


We suspected that data quality was a topic brimming with interest. Those suspicions were confirmed when we quickly received more than 1,900 responses to our mid-November survey request. The responses show a surfeit of concerns around data quality and some uncertainty about how best to address those concerns.
Key survey results:
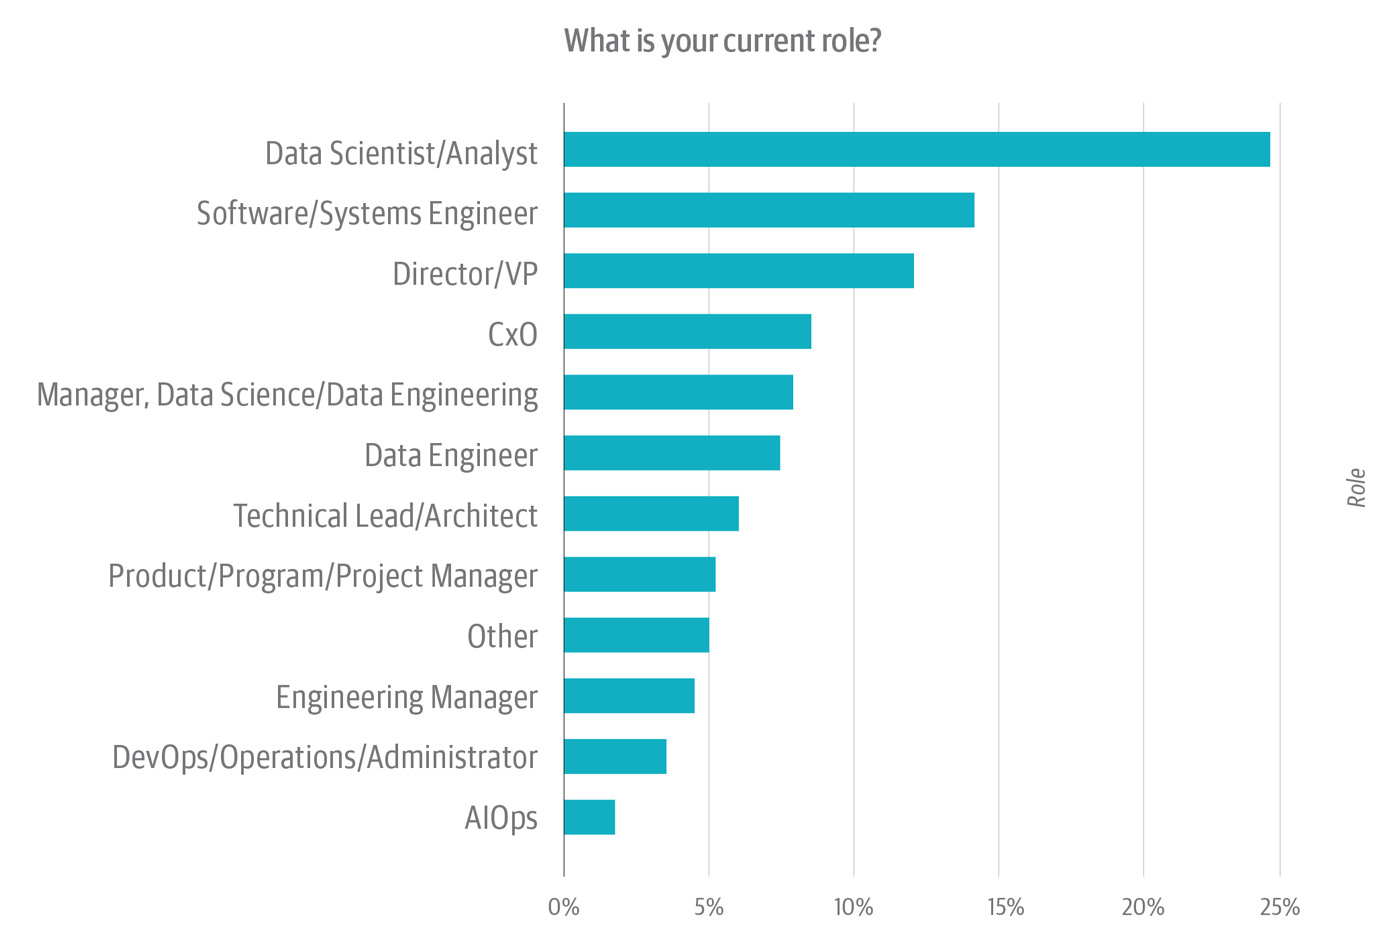
- The C-suite is engaged with data quality. CxOs, vice presidents, and directors account for 20% of all survey respondents. Data scientists and analysts, data engineers, and the people who manage them comprise 40% of the audience; developers and their managers, about 22%.
- Data quality might get worse before it gets better. Comparatively few organizations have created dedicated data quality teams. Just 20% of organizations publish data provenance and data lineage. Most of those who don’t say they have no plans to start.
- Adopting AI can help data quality. Almost half (48%) of respondents say they use data analysis, machine learning, or AI tools to address data quality issues. Those respondents are more likely to surface and address latent data quality problems. Can AI be a catalyst for improved data quality?
- Organizations are dealing with multiple, simultaneous data quality issues. They have too many different data sources and too much inconsistent data. They don’t have the resources they need to clean up data quality problems. And that’s just the beginning.
- The building blocks of data governance are often lacking within organizations. These include the basics, such as metadata creation and management, data provenance, data lineage, and other essentials.
The top-line good news is that people at all levels of the enterprise seem to be alert to the importance of data quality. The top-line bad news is that organizations aren’t doing enough to address their data quality issues. They’re making do with inadequate—or non-existent—controls, tools, and practices. They’re still struggling with the basics: tagging and labeling data, creating (and managing) metadata, managing unstructured data, etc.
Respondent demographics
Analysts and engineers predominate
Nearly one-quarter of respondents work as data scientists or analysts (see Figure 1). An additional 7% are data engineers. On top of this, close to 8% manage data scientists or engineers. That means that about 40% of the sample consists of front-line practitioners. This is hardly surprising. Analysts and data engineers are, arguably, the people who work most closely with data.
In practice, however, almost every data scientist and analyst also doubles as a data engineer: she spends a significant proportion of her time locating, preparing, and cleaning up data for use in analysis. In this way, data scientists and data analysts arguably have a personal stake in data quality. They’re often the first to surface data quality problems; in organizations that do not have dedicated data quality teams (or analogous resources, such as data quality centers of excellence), analysts play a leading role in cleaning up and correcting data quality issues, too.
A switched-on C-suite?
Respondents who work in upper management—i.e., as directors, vice presidents, or CxOs—constitute a combined one-fifth of the sample. This is surprising. These results suggest that data quality has achieved salience of some kind in the minds of upper-level management. But what kind of salience? That’s a tricky question.
Role-wise, the survey sample is dominated by (1) practitioners who work with data and/or code and (2) the people who directly manage them—most of whom, notionally, also have backgrounds in data and/or code. This last point is important. A person who manages a data science or data engineering team—or, for that matter, a DevOps or AIOps practice—functions for all intents and purposes as an interface between her team(s) and the person (also typically a manager) to whom she directly reports. She’s “management,” but she’s still at the front line. And she likely also groks the practical, logistical, and political issues that (in their intersectionality) combine to make data quality such a thorny problem.
Executives bring a different, transcendent, perspective to bear in assessing data quality, particularly with respect to its impact on business operations and strategy. Executives see the big picture, not only vis-à-vis operations and strategy, but also with respect to problems—and, especially, complaints—in the units that report to them. Executive buy-in and support is usually seen as one of the pillars of any successful data quality program because data quality is more a people-and-process-laden problem than a technological one. It isn’t just that different groups have differing standards, expectations, or priorities when it comes to data quality; it’s that different groups will go to war over these standards, expectations, and priorities. Data quality solutions almost always boil down to two big issues: politics and cost. Some group(s) are going to have to change the way they do things; the money to pay for data quality improvements must come out of this or that group’s budget.
Executive interest can be a useful—if not infallible—proxy for an organization’s posture with respect to data quality. Historically, the executive who understood the importance of data quality was an exception, with few enlightened CxOs spearheading data quality initiatives or helping kick-start a data quality center of excellence. Whether due to organizations becoming more data driven, or the increased attention paid to the effects of data quality on AI efforts, increased C-suite buy-in is a positive development.
Organizational demographics
About half of survey respondents are based in North America. Slightly more than a quarter are in Europe—inclusive of the United Kingdom—while about one-sixth are in Asia. Combined, respondents in South America and the Middle East account for just under 10% of the survey sample.
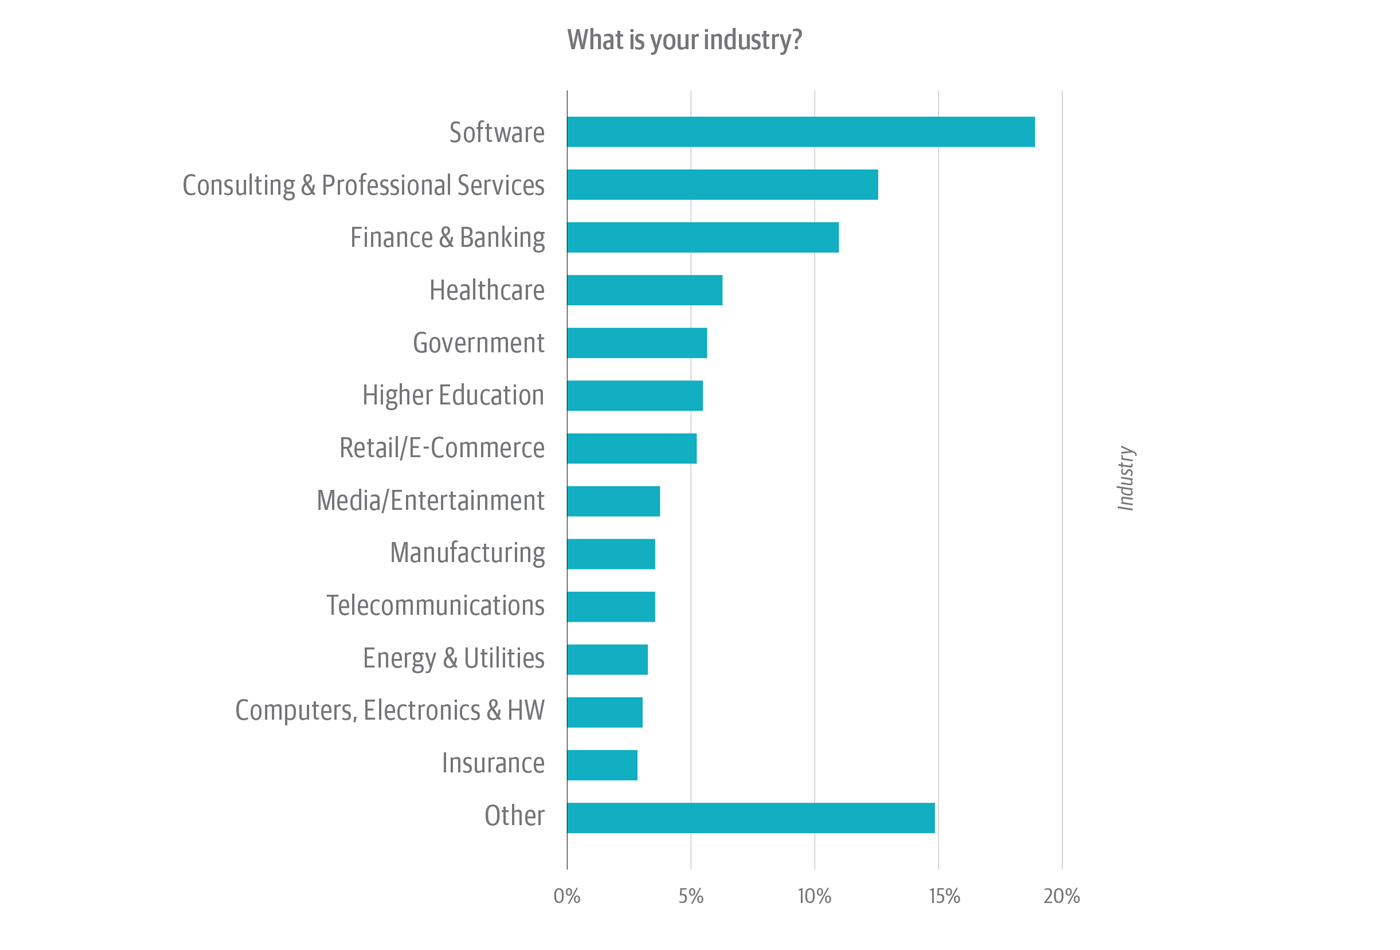
Drilling down deeper, almost two-fifths of the survey audience works in tech-laden verticals such as software, consulting/professional services, telcos, and computers/hardware (Figure 2). This could impart a slight tech bias to the results. On the other hand, between 5% and 10% of respondents work in each of a broad swath of other verticals, including: healthcare, government, higher education, and retail/e-commerce. (“Other,” the second largest category, with about 15% of respondents, encompasses more than a dozen other verticals.) So concern about tech-industry bias could be offset by the fact that virtually all industries are, in effect, tech-dependent.
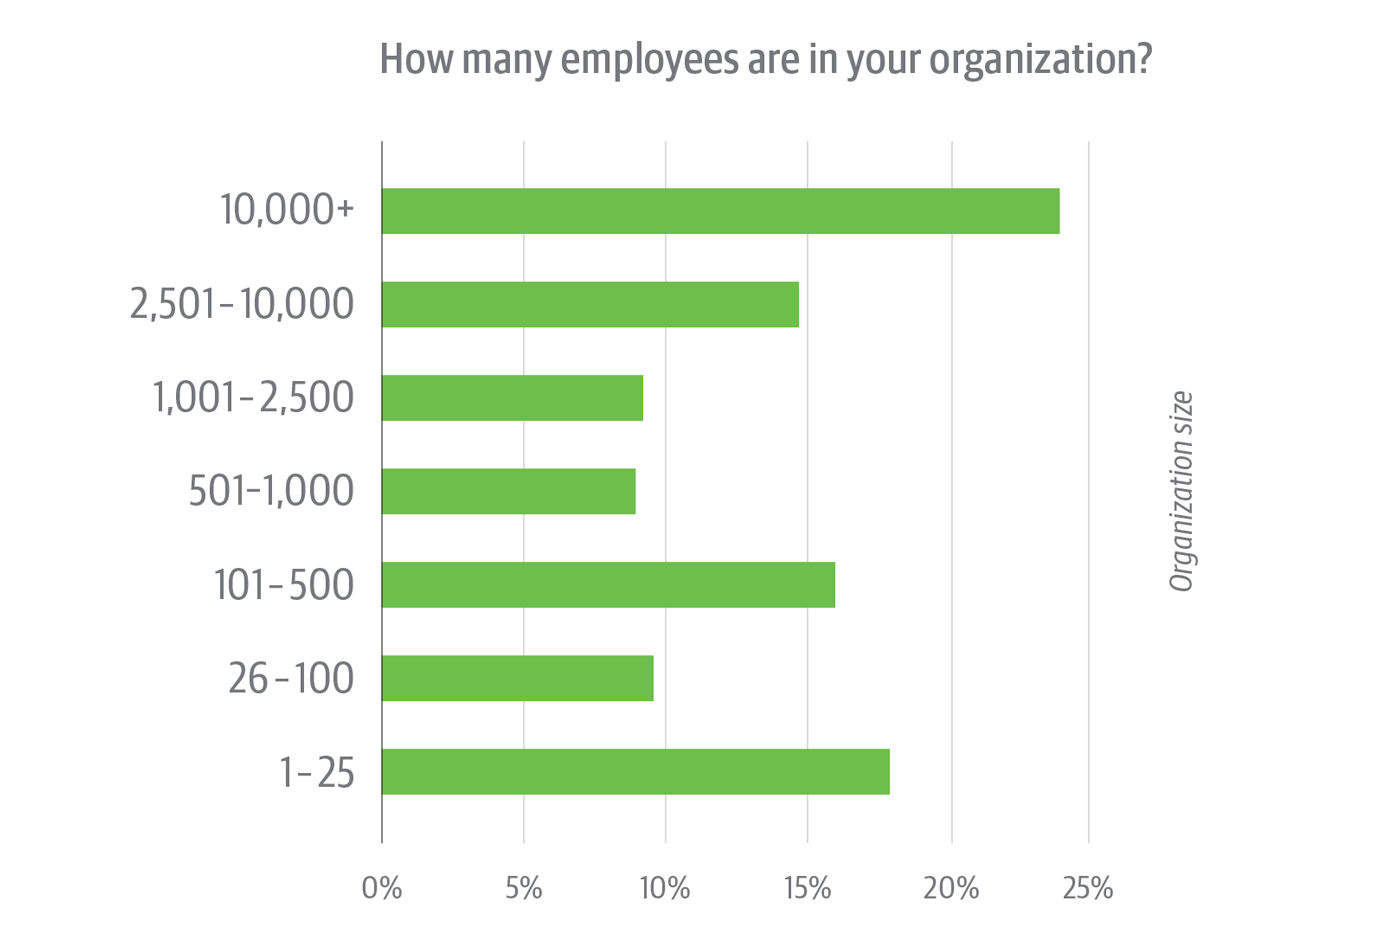
Size-wise, there’s a good mix in the survey base: nearly half of respondents work in organizations with 1,000 employees or more; slightly more than half, at organizations with 1,000 employees or less.
Data quality issues and affects
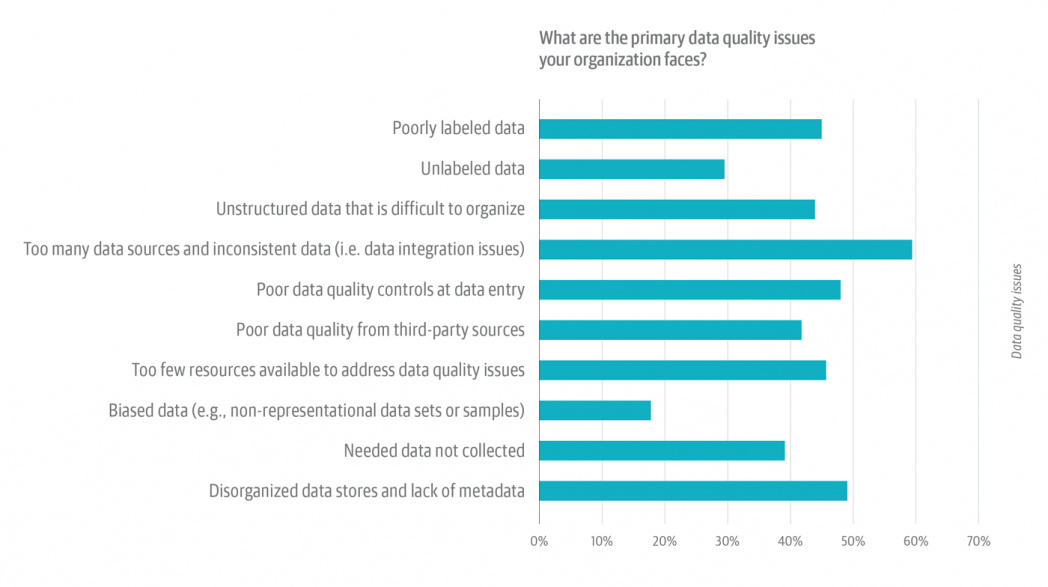
We asked respondents to select from among a list of common data quality problems. Respondents were encouraged to select all issues that apply to them (Figure 4).
Too many data sources, too little consistency
By a wide margin, respondents rate the sheer preponderance of data sources as the single most common data quality issue. More than 60% of respondents selected “Too many data sources and inconsistent data,” followed by “Disorganized data stores and lack of metadata,” which was selected by just under 50% of respondents (Figure 4).
There’s something else to think about, too. This was a select-all-that-apply-type question, which means that you’d expect to see some inflation for the very first option on the list, i.e., “Poorly labeled data,” which was selected by just under 44% of respondents. Choosing the first item in a select-all-that-apply list is a human behavior statisticians have learned to expect and (if necessary) to control for.
But “Poorly labeled data” was actually the fifth most common problem, trailing not only the issues above, but “Poor data quality controls at data entry” (selected by close to 47%) and “Too few resources available to address data quality issues” (selected by less than 44%), as well. On the other hand, the combination of “Poorly labeled data” and “Unlabeled data” tallies close to 70%.
There’s good and bad in this. First, the bad: reducing the number of data sources is hard.
IT fought the equivalent of a rear-guard action against this very problem through most of the 1990s and 2000s. Data management practitioners even coined a term—“spreadmart hell”—to describe what happens when several different individuals or groups maintain spreadsheets of the same data set. The self-service use case helped exacerbate this problem: the first generation of self-service data analysis tools eschewed features (such as metadata creation and management, provenance/lineage tracking, and data synchronization) that are essential for data quality and good data governance.
In other words, the sheer preponderance of data sources isn’t a bug: it’s a feature. If history is any indication, it’s a problem that isn’t going to go away: multiple, redundant, sometimes inconsistent copies of useful data sets will always be with us.
On the good side, technological progress—e.g., front-end tools that generate metadata and capture provenance and lineage; data cataloging software that manages provenance and lineage—could tamp down on this. So, too, could cultural transformation: e.g., a top-down push to educate people about data quality, data governance, and general data literacy.
Organizations are flunking Data Governance 101
Some common data quality issues point to larger, institutional problems. “Disorganized data stores and lack of metadata” is fundamentally a governance issue. But just 20% of survey respondents say their organizations publish information about data provenance or data lineage, which—along with robust metadata—are essential tools for diagnosing and resolving data quality issues. If the management of data provenance/lineage is taken as a proxy for good governance, few organizations are making the cut. Nor is it surprising that so many respondents also cite unlabeled/poorly labeled data as a problem. You can’t fake good governance.
Still another hard problem is that of “Poor data quality controls at data entry.” Anyone who has worked with data knows that data entry issues are persistent and endemic, if not intractable.
Some other common data quality issues (Figure 4)—e.g., poor data quality from third-party sources (cited by about 36% of respondents), missing data (about 37%), and unstructured data (more than 40%)—are less insidious, but no less frustrating. Practitioners may have little or no control over providers of third-party data. Missing data will always be with us—as will an institutional reluctance to make it whole. As for a lack of resources (cited by more than 40% of respondents), there’s at least some reason for hope: machine learning (ML) and artificial intelligence (AI) could provide a bit of a boost. Data engineering and data analysis tools use ML to simplify and substantively automate some of the tasks involved in discovering, profiling, and indexing data.
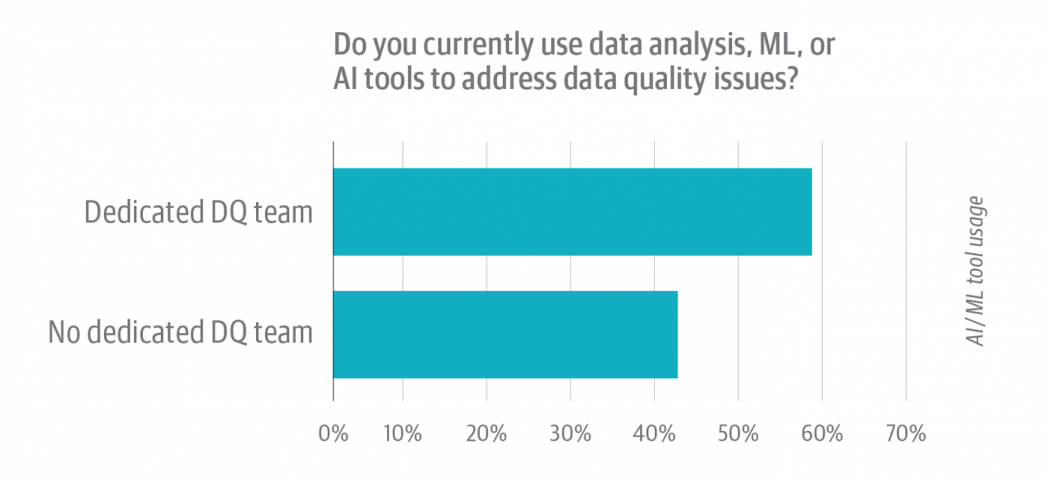
Not surprisingly, almost half (48%) of respondents say they use data analysis, machine learning, or AI tools to address data quality issues. A deeper dive (Figure 5) provides an interesting take: organizations that have dedicated data quality teams use analytic and AI tools at a higher rate, 59% compared to the 42% of respondents from organizations with no dedicated data quality team. Having a team focused on data quality can provide the space and motivation to invest in trying and learning tools that make the team more productive. Few data analysts or data engineers have the time or capacity to make that commitment, instead relying on ad hoc methods to address the data quality issues they face.
That being said, data quality, like data governance, is fundamentally a socio-technical problem. ML and AI can help to an extent, but it’s incumbent on the organization itself to make the necessary people and process changes. After all, people and processes are almost always implicated in both the creation and the perpetuation of data quality issues. Ultimately, diagnosing and resolving data quality problems requires a genuine commitment to governance.
Data conditioning is expensive and resource intensive (and decidedly not sexy), one of the reasons we don’t see more formal support for data quality amongst respondents. To increase the focus on resolving data issues requires carefully scrutinizing the ROI of data conditioning efforts to focus on the most worthwhile, productive, and effective efforts.
Biases, damned biases, and missing data
Just under 20% of respondents cited “Biased data” as a primary data quality issue (Figure 4). We often talk about the need to address bias and fairness in data. But here the evidence suggests that respondents see bias as less problematic than other common data quality issues. Do they know something we don’t? Or are respondents themselves biased—in this case, by what they can’t imagine? This result underscores the importance of acknowledging that data contains biases; that we should assume (not rule out) the existence of unknown biases; and that we should promote the development of formal diversity (cognitive, cultural, socio-economic, physical, background, etc.) and processes to detect, acknowledge, and address those biases.
Missing data plays into this, too. It isn’t just that we lack the data we believe we need for the work we want to do. Sometimes we don’t know or can’t imagine what data we need. A textbook example of this comes via Abraham Wald’s analysis of how to improve the placement of armor on World War II-era bombers: Wald wanted to study the bombers that had been shot down, which was practically impossible. However, he was able to make inferences about the effect of what is now called survivor bias by factoring in what was missing, i.e., that the planes that returned from successful missions had an inverse pattern of damage relative to those that had been shot down. His insight was a corrective to the collective bias of the Army’s Statistical Research Group (SRG). The SRG could not imagine that it was missing data.
No data quality issue is an island entire of itself
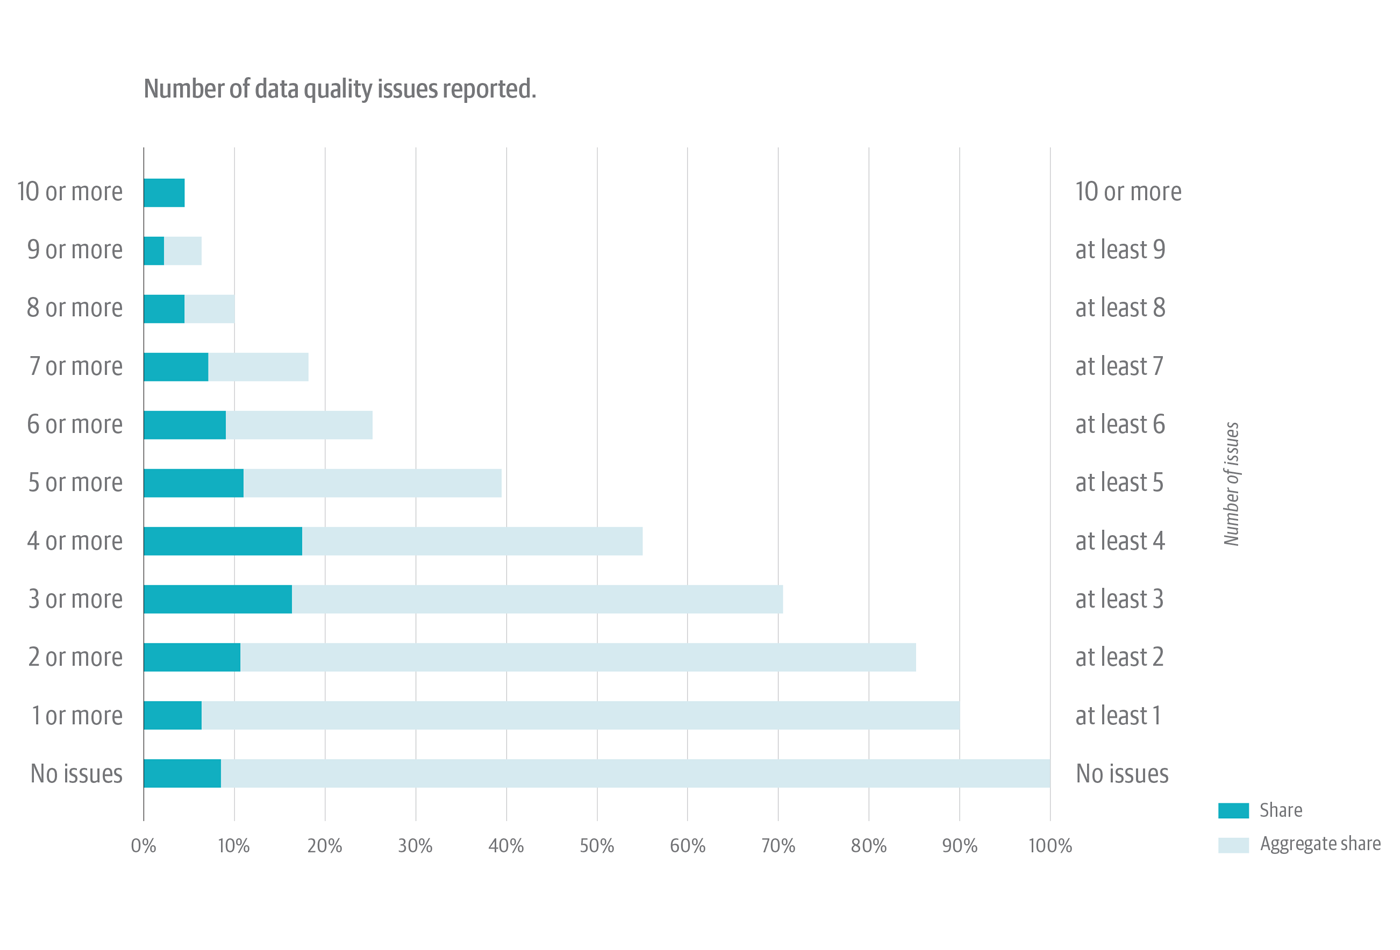
Organizations aren’t dealing with only one data quality issue. It’s more complicated than that—with more than half of respondents reporting at least four data quality issues.
Figure 6, below, combines two things. The dark green portion of each horizontal bar shows the share of survey respondents who reported that specific number of discrete data quality issues at their organizations (i.e., 3 issues or 4 issues, etc.). The light gray/green portion of each bar shows the aggregate share of respondents who reported at least that number of data quality issues (i.e., at least 2 issues, at least 3 issues, etc.).
A few highlights to help navigate this complex chart:
- Respondents most often report either three or four data quality issues. The dark green portion of the horizontal bars show about 16% of respondents for each of these results.
- Looking at the aggregates of the “at least 4” and “at least 3” items, we see the light gray/green section of the chart shows 56% of respondents reporting at least four data quality issues and 71% reporting at least three data quality issues.
That organizations face myriad data quality issues is not a surprise. What is surprising is that organizations don’t more often take a structured or formal approach to addressing their own unique, gnarly combination of data quality challenges.
Lineage and provenance continue to lag
A significant majority of respondents—almost 80%—say their organizations do not publish information about data provenance or data lineage.
If this is surprising, it shouldn’t be. Lineage and provenance are inextricably bound with data governance, which overlaps significantly with data quality. As we saw, most organizations are failing Data Governance 101. Data scientists, data engineers, software developers, and other technologists use provenance data to verify the output of a workflow or data processing pipeline—or, as often as not, to diagnose problems. Provenance notes where the data in a data set came from; which transformations, if any, have been applied to it; and other technical minutiae.
With respect to business intelligence and analytics, data lineage provides a mechanism business people, analysts, and auditors can use to trust and verify data. If an auditor has questions about the values in a report or the contents of a data set, they can use the data lineage record to retrace its history. In this way, provenance and lineage give us confidence that the content of a data set is both explicable and reproducible.
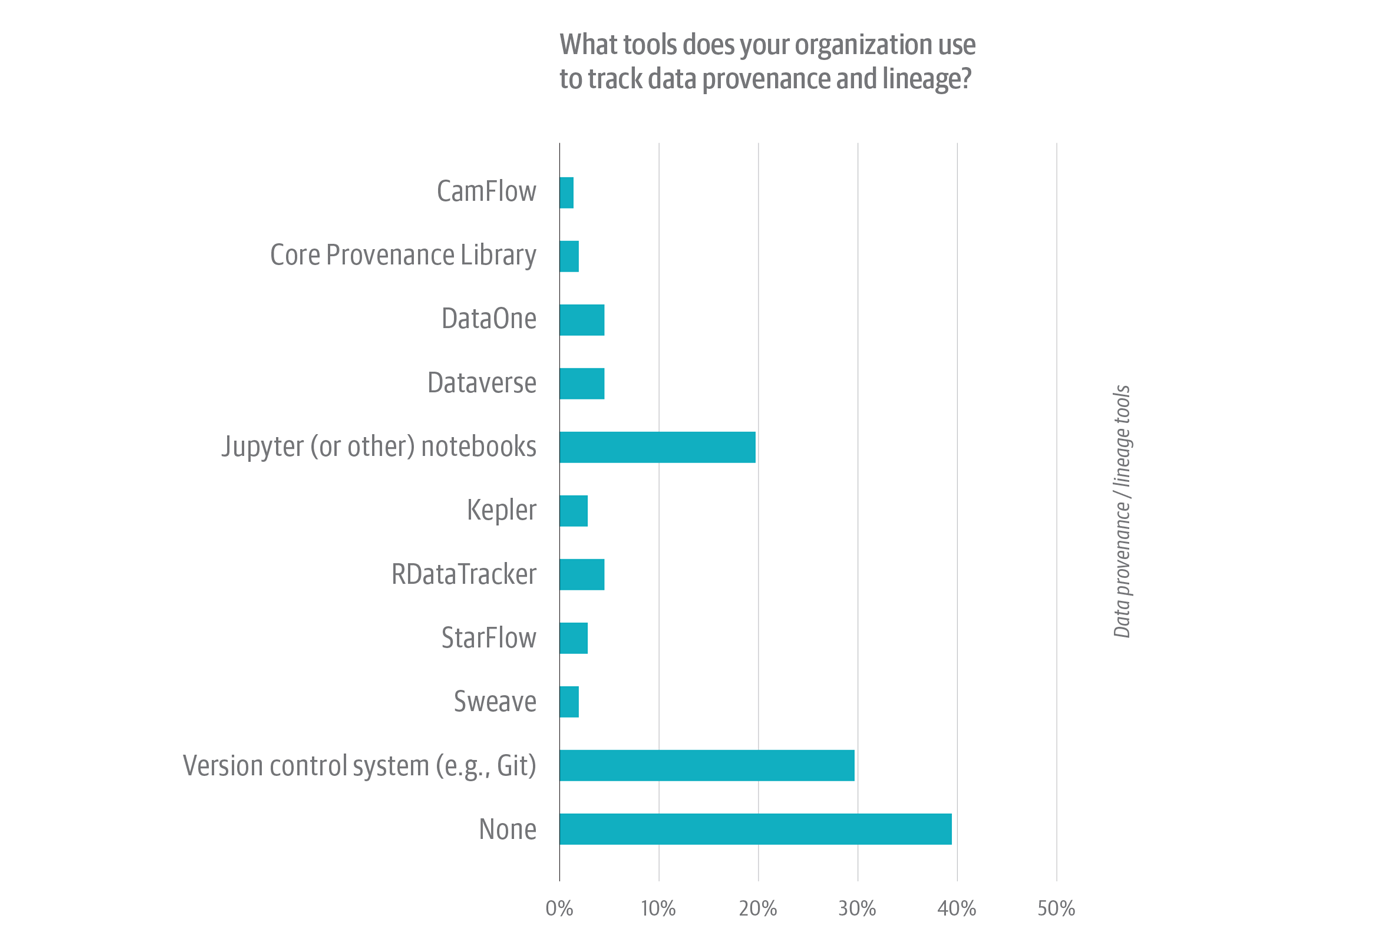
Of the 19% of survey respondents whose organizations do manage lineage and provenance, slightly less than 30% say they use a version control system—a la Git—to do this (Figure 7). Another one-fifth use a notebook environment (such as Jupyter). The remaining 50% (i.e., of respondents whose organizations do publish lineage and provenance) use a smattering of open source and commercial libraries and tools, most of which are mechanisms for managing provenance, not lineage.
If provenance and lineage are so important, why do few organizations publish information about them?
Because lineage, especially, is hard. It imposes access and use constraints that make it more difficult for business people to do what they want with data—especially as regards sharing and/or changing it. First-generation self-service analytic tools made it easier—and, in some cases, possible—for people to share and experiment with data. But the ease-of-use and agency that these tools promoted came at a price: first-gen self-service tools eschewed data lineage, metadata management, and other, similar mechanisms.
A best practice for capturing data lineage is to incorporate mechanisms for generating and managing metadata—including lineage metadata—into front- and back-end tools. ETL tools are a textbook example of this: almost all ETL tools generate granular (“technical”) lineage data. Until recently, however, most self-service tools lacked rich metadata management features or capabilities.
This might explain why nearly two-thirds of respondents whose organizations do not publish provenance and lineage answered “No” to the follow-up question: “Does your organization plan on implementing tools or processes to publish data provenance and lineage?” For the vast majority of organizations, provenance and lineage is a dream deferred (Figure 8).
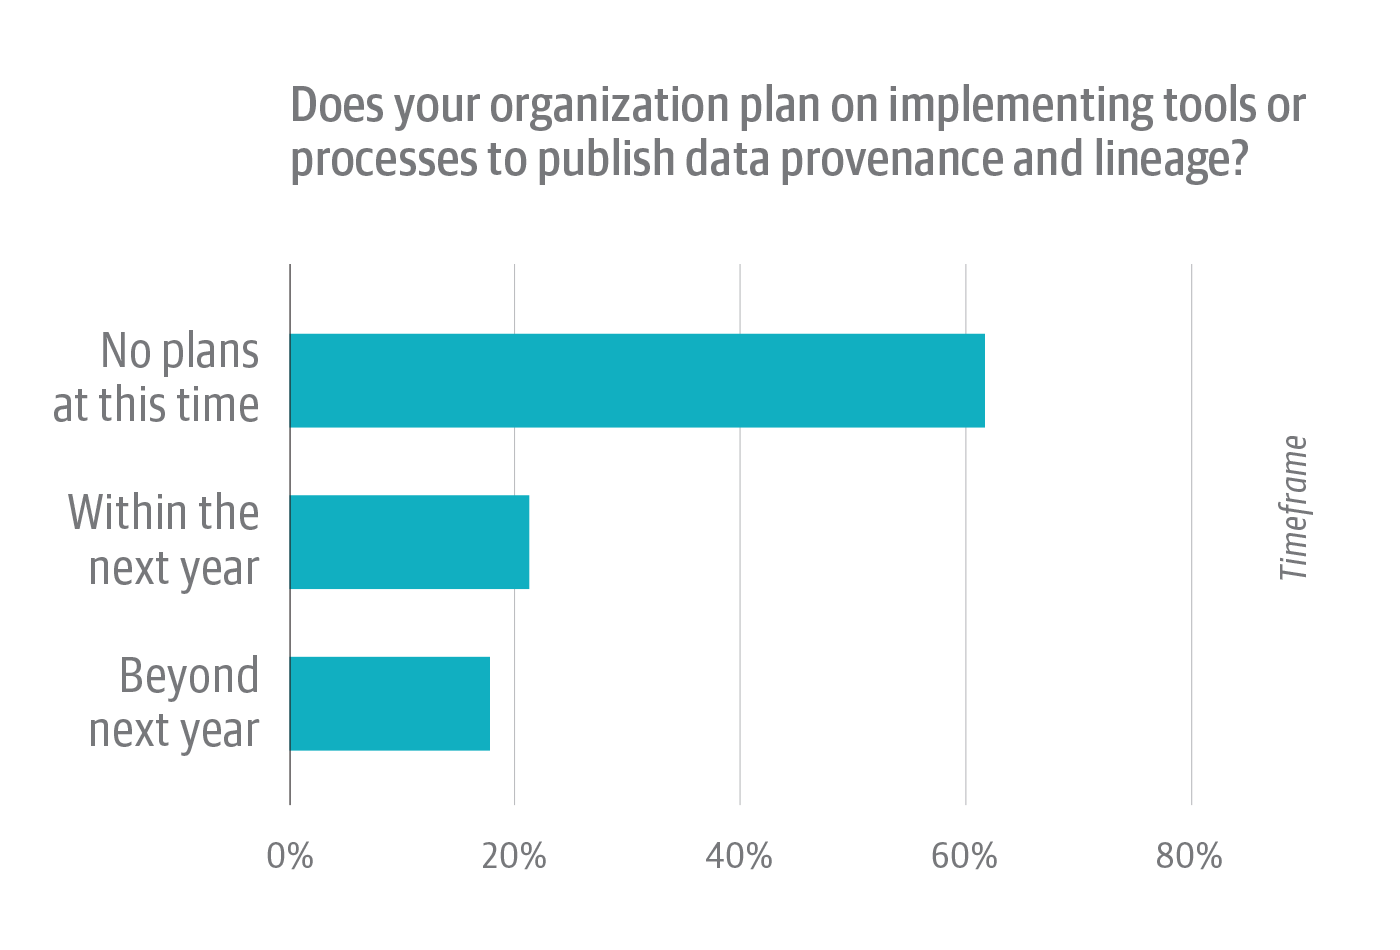
The good news is that the pendulum could be swinging in the direction of governance.
Slightly more than one-fifth selected “Within the next year” in response to this question, while about one-sixth answered “Beyond next year.” Most popular open source programming and analytic environments (Jupyter Notebooks, the R environment, even Linux itself) support data provenance via built-in or third-party projects and libraries. Commercial data analysis tools now offer increasingly robust metadata management features. In the same way, data catalog vendors, too, are making metadata management—with an emphasis on data lineage—a priority. Meanwhile, the Linux Foundation sponsors Egeria, an open source standard for metadata management and exchange.
Data quality is not a team effort
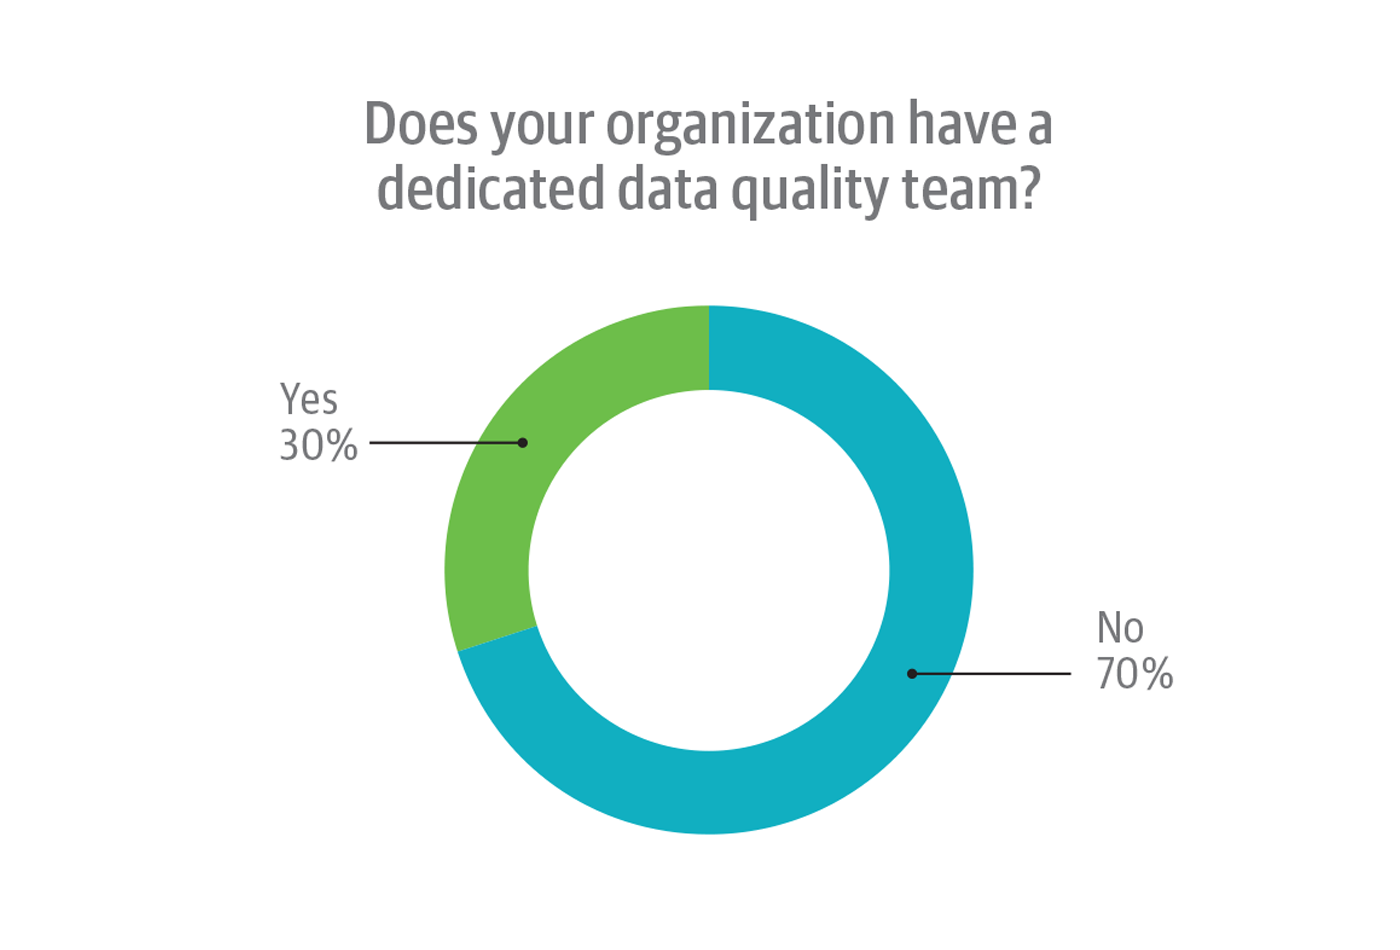
Based on feedback from respondents, comparatively few organizations have created dedicated data quality teams (Figure 9). Most (70%) answered “No” to the question “Does your organization have a dedicated data quality team?”
Few respondents who answered “Yes” to this question actually work on their organization’s dedicated data quality team. Nearly two-thirds (62%) answered “No” to the follow-up question “Do you work on the dedicated data quality team?”; just 38% answered “Yes.” Only respondents who answered “Yes” to the question “Does your organization have a dedicated data quality team?” were permitted to answer the follow-up. All told, 12% of all survey respondents work on a dedicated data quality team.
Real-time data on the rise
Relatedly, we asked respondents who work in organizations that do have dedicated data quality teams if these teams also work with real-time data.
Almost two-thirds (about 61%) answered “Yes.” We know from other research that organizations are prioritizing efforts to do more with real-time data. In our recent analysis of Strata Conference speakers’ proposals, for example, terms that correlate with real-time use cases were entrenched in the first tier of proposal topics. “Stream” was the No. 4 overall term; “Apache Kafka,” a stream-processing platform, was No. 17; and “real-time” itself sat at No. 44.
“Streaming” isn’t identical with “real-time,” of course. But there is evidence for overlap between the use of stream-processing technologies and so-called “real-time” use cases. Similarly, the rise of next-gen architectural regimes (such as microservices architecture) is also driving demand for real-time data: A microservices architecture consists of hundreds, thousands, or tens of thousands of services, each of which generates logging and diagnostic data in real-time. Architects and software engineers are building observability—basically, monitoring on steroids—into these next-gen apps to make it easier to diagnose and fix problems. This is a compound real-time data and real-time analytics problem.
The world is not a monolith
For the most part, organizations in North America seem to be dealing with the same problems as their counterparts in other regions. Industry representation, job roles, employment experience, and other indicia were surprisingly consistent across all regions—although there were a few intriguing variances. For example, the proportion of “directors/vice presidents” was about one-third higher for North American respondents than for the rest of the world, while the North American proportion of consulting/professional services respondents was close to half the tally for the rest of the globe.
Our analysis surfaced at least one other intriguing geographical variance. As noted in Figure 9, we asked each participant if their organization maintains a dedicated data quality team. While North America and the rest of the world had about the same share of respondents with dedicated data quality teams, our North American respondents were less likely to work on that data quality team.
Takeaways
A review of the survey results yields a few takeaways organizations can use to realistically address how they can condition their data to improve the efficacy of their analytics and models.
- Most organizations should take formal steps to condition and improve their data, such as creating dedicated data quality teams. But conditioning data is an on-going process, not a one-and-done panacea. This is why C-suite buy-in—as difficult as it is to obtain—is a prerequisite for sustained data quality remediation. Promoting C-suite understanding and commitment may require education as many execs have little or no experience working with data or analytics.
- Conditioning is neither easy nor cheap. Committing to formal processes and dedicated teams helps set expectations about the difficult work of remediating data issues. High costs should compel organizations to take an ROI-based approach to how and where to deploy their data conditioning resources. This includes deciding what is not worth addressing.
- Organizations that pursue AI initiatives usually discover that they have data quality issues hiding in plain sight. The problem (and partial solution) is that they need quality data to power their AI projects. Think of AI as the carrot, and of poor data as the proverbial stick. The upshot is that investment in AI can become a catalyst for data quality remediation.
- AI is an answer, but not the only one. AI-enriched tools can improve productivity and simplify much of the work involved in improving data efficacy. But our survey results suggest that a dedicated data quality team also helps to foster the use of AI-enriched tools. What’s more, a dedicated team is motivated to invest in learning to use these tools well; conversely, few analysts and data engineers have the time or capacity to fully master these tools.
- Data governance is all well and good, but organizations need to start with more basic stuff: data dictionaries to help explain data; tracking provenance, lineage, recency; and other essentials.