Surfacing anomalies and patterns in machine data
Compelling large-scale data platforms originate from the world of IT Operations
I’ve been noticing that many interesting big data systems are coming out of IT operations. These are systems that go beyond the standard “capture/measure, display charts, and send alerts”. IT operations has long been a source of many interesting big data1 problems and I love that it’s beginning to attract the attention2 of many more data scientists and data engineers.
It’s not surprising that many of the interesting large-scale systems that target time-series and event data have come from ops teams: in an earlier post on time-series, several of the tools I highlighted came out of IT operations. IT operations involves monitoring many different hardware and software systems, a task that requires a variety of tools and which quickly leads to “metrics overload”. A partial list includes data captured from a wide range of application log files, network traffic, energy and power sources.
The volume of IT ops data has led to new tools like OpenTSDB and KairosDB – time series databases that leverage HBase and Cassandra. But storage, simple charts, and lookups are just the foundation of what’s needed. IT Ops track many interdependent systems, some of which might be correlated3. Not only are IT ops faced with highlighting “unknown unknowns” in their massive data sets, they often need to do so in near realtime.
Analytics on machine data
After carefully instrumenting systems with data gathering agents, the next step is featurization: turning unstructured (or semi-structured) text into features that can be fed into algorithms. If the data (mostly log files) is simple enough, rule-based, regex tools suffice. For open source systems, features can be discovered using information extracted from source code.
Anomaly detection is the first thing addressed by many systems. The main challenge is that alerts and early warning systems get trickier to implement when one is tracking lots of metrics simultaneously. Etsy’s Kale stack targets the specific problem of monitoring lots of interdependent time-series. It includes tools for near realtime4 anomaly (Skyline) and correlation (Oculus) detection. Kale efficiently stores time series in Redis, relies on a consensus model for anomaly detection, and uses ElasticSearch and dynamic time warping to identify associations.
The use of data science techniques in IT ops data isn’t completely new5. The best systems draw upon the domain expertise of those who deal with IT systems on a regular basis. SaaS company SumoLogic uses machine-learning to help users wade through large amounts of log files (using a system aptly named, LogReduce). The company also leverages user interaction data to further refine and personalize results produced by LogReduce (in essence domain expertise of users improves SumoLogic’s service). Boundary uses network data to quickly detect (and even forecast) when services aren’t behaving normally. Users then turn to the company’s intuitive interface to drill-down to the specific6 root causes, in realtime.
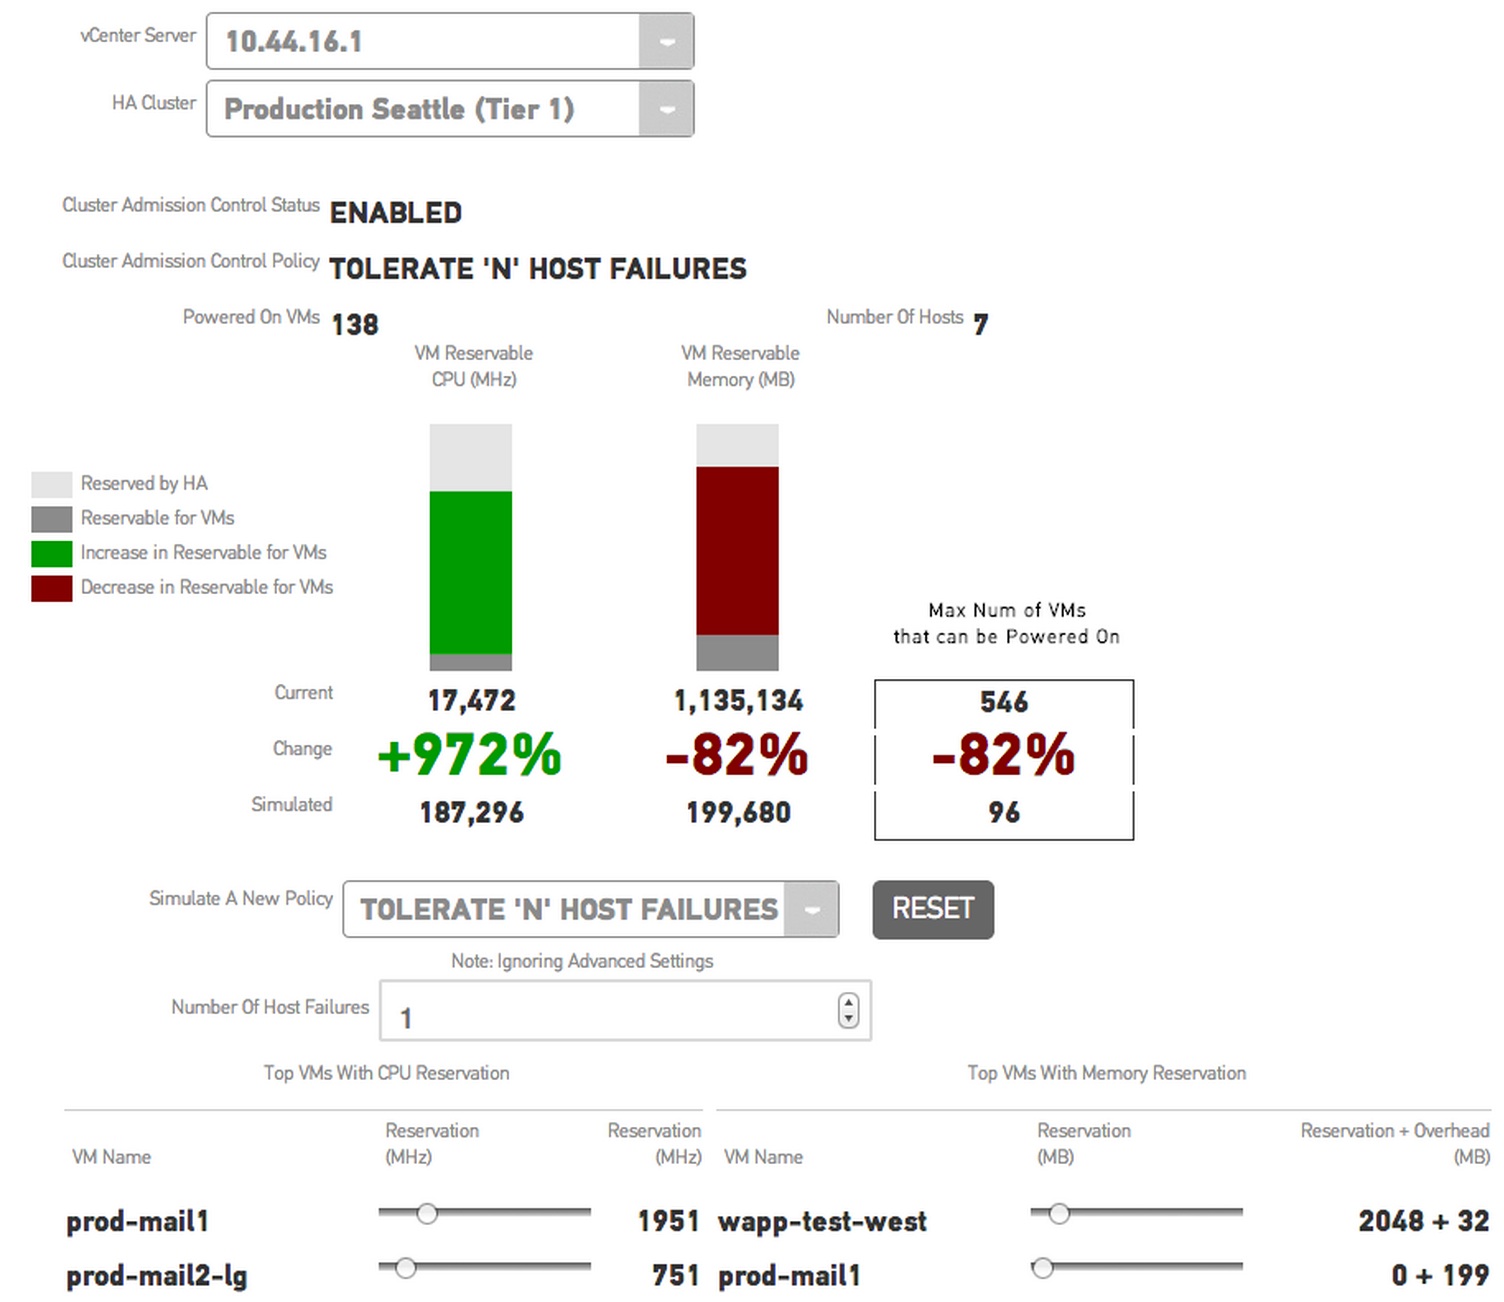
Virtualized environments involve subtle interdependencies (e.g., memory, cpu, network, storage) that can be challenging for sysadmins to manage. CloudPhysics is launching a system that lets IT systems monitor their VMWare deployments, and draw on crowdsourced7 data to run simulations. The company uses simple scorecards to inform users of the current state of their systems and provide recommendations. Their simulation tools can be used to determine the impact of proposed upgrades or configuration changes, on existing production systems:

With the right data, interface, and analytics, simulators can really be helpful to decision makers. CloudPhysics hides massive amounts of data behind an elegant interface. I’d love to see more (big data) simulators crop up in other settings.
Related posts:
