
 Clusters of stromatolites growing in Hamelin Pool Marine Nature Reserve, Shark Bay in Western Australia. (source: Paul Harrison on Wikimedia Commons)
 Machine learning, and in particular clustering algorithms, can be used to determine which geographical areas are commonly visited and “checked into” by a given user and which areas are not. Such geographical analyses enable a wide range of services, from location-based recommenders to advanced security systems, and in general provide a more personalized user experience.
In this post, I’ll determine geographical areas that are specific and personal to each user and look at how to build location-based services by extracting users’ geographical regions from numerous geolocated events, such as check-ins in restaurants or cafes. Such a system could identify, for instance, areas that a given user typically frequents for dinner outings.
Using the DBSCAN clustering algorithm
First, we’ll need to select a clustering algorithm that works well with geographical data and that can determine users’ geographical areas based on the local density of the provided data points. The DBSCAN algorithm is a good choice, as it works bottom-up by picking a point and looking for more points within a given distance. It then expands the cluster by repeating this process for new points until the cluster cannot be further expanded.
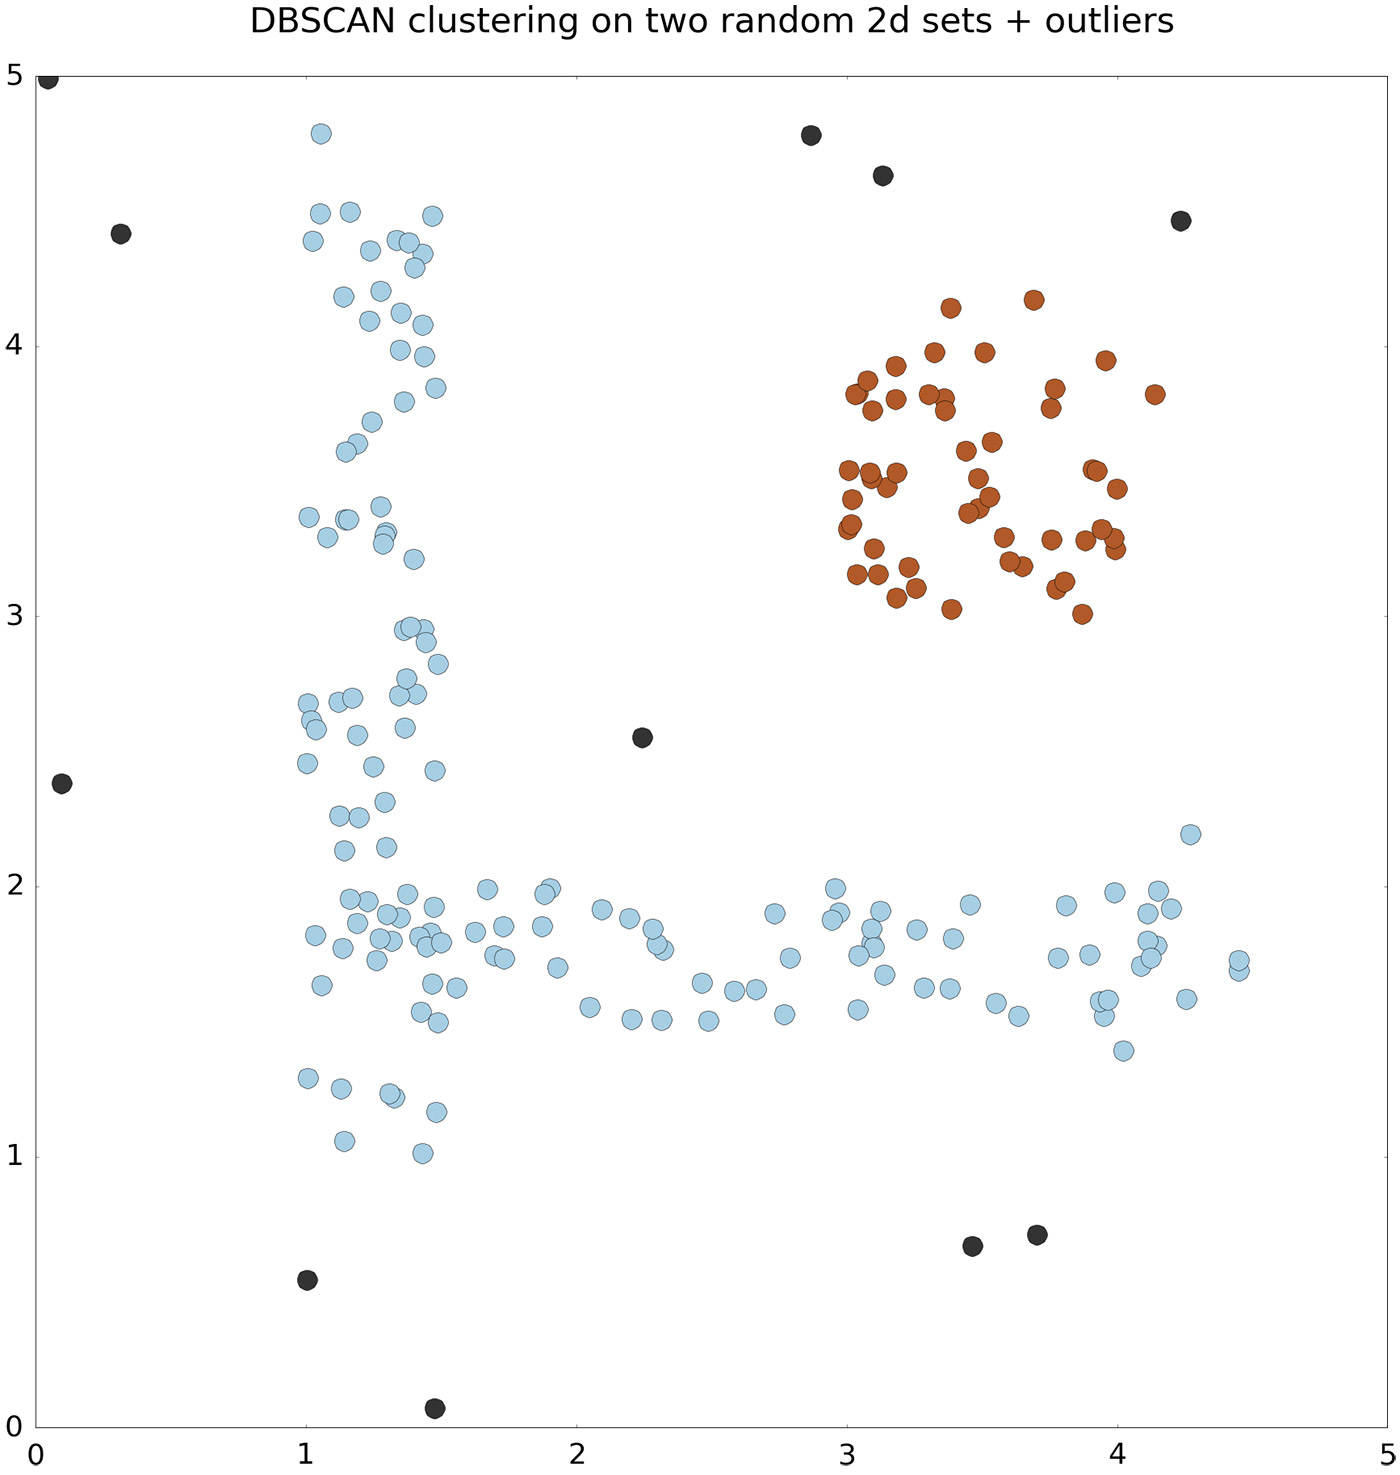
This algorithm can be tuned with two parameters: epsilon, which determines how far to search for points near a given point, and minPoints, which determines how many points should be present in the neighborhood of a given point in order to keep expanding a given cluster. Since the clusters emerge locally by looking for neighboring points, clusters of various shapes can be detected (see a simplified depiction in Figure 1). Points that are isolated and too far from any other point are assigned to a special cluster of outliers. These discerning properties make the DBSCAN algorithm a good candidate for clustering geolocated events.
Using PairRDDs in Spark
In most real-world applications, machine learning systems have to deal with millions of users and billions of events. Therefore, a well-engineered data processing pipeline needs to be fast and scalable as more users and events are added to the system. This calls for distributed computing. For our purposes here, Spark, a distributed processing engine, is a good choice, as it provides the framework to perform many location-clustering tasks in parallel on multiple machines.
Users’ geolocated data can be modelled in Spark using objects called PairRDDs. A PairRDD is a distributed collection of tuples (key, value) that is partitioned to multiple machines according to the key field. In particular, for geolocated data, we choose the key to be the user identifier, and the value to be the aggregated list of all check-ins posted by that given user.
The geolocated data is arranged in a n-by-2 matrix, where the first column represents the latitude and the second column the longitude. See below for the Spark data type of a PairRDD collection and an example of a tuple:
org.apache.spark.rdd.RDD[(Long, breeze.linalg.DenseMatrix[Double])]

(15474,  DenseMatrix( 40.8379525833 -73.70209875
                      40.6997066969 -73.8085234165
                      40.7484436586 -73.9857316017
                      40.750613794  -73.993434906 ))
Parallelizing DBSCAN with Spark
The DBSCAN algorithm is available in several languages and packages. The following code snippet is based on DBSCAN as implemented in the scala repository nlp/nak on GitHub.
Suppose that a given user frequently visits three areas in a city—one for drinks and parties, another for cozy and relaxing coffee breaks, and a yet another for dinners with friends. If these areas are located in different parts of the city, the following code will partition the events in different clusters by looking at each location. In this code, we look for events close in proximity, in the range of 100 meters (about 0.001 degrees), and we start clustering if there are at least three points close to each other.
import breeze.numerics._
import nak.cluster._
import nak.cluster.GDBSCAN._

def dbscan(v : breeze.linalg.DenseMatrix[Double]) = {
  val gdbscan = new GDBSCAN(
    DBSCAN.getNeighbours(epsilon = 0.001, distance = Kmeans.euclideanDistance),
    DBSCAN.isCorePoint(minPoints = 3)
  )
  val clusters = gdbscan cluster v
}
Then, we will use Spark to parallelize the dbscan function for the entire collection of users. This operation is already available as part of Spark’s PairRDD functions and it’s called mapValues:
val clustersRdd = checkinsRdd.mapValues(dbscan(_))
In short, clustering geolocated data can be implemented in Spark by transforming the original PairRDD of locations into a new PairRDD where the key-value tuples represent the users’ IDs and the list of geolocated clusters for each user, respectively. Once the geolocated data has been grouped into clusters, it can be further summarized—for instance, by determining the bounding box or the contour of each cluster.
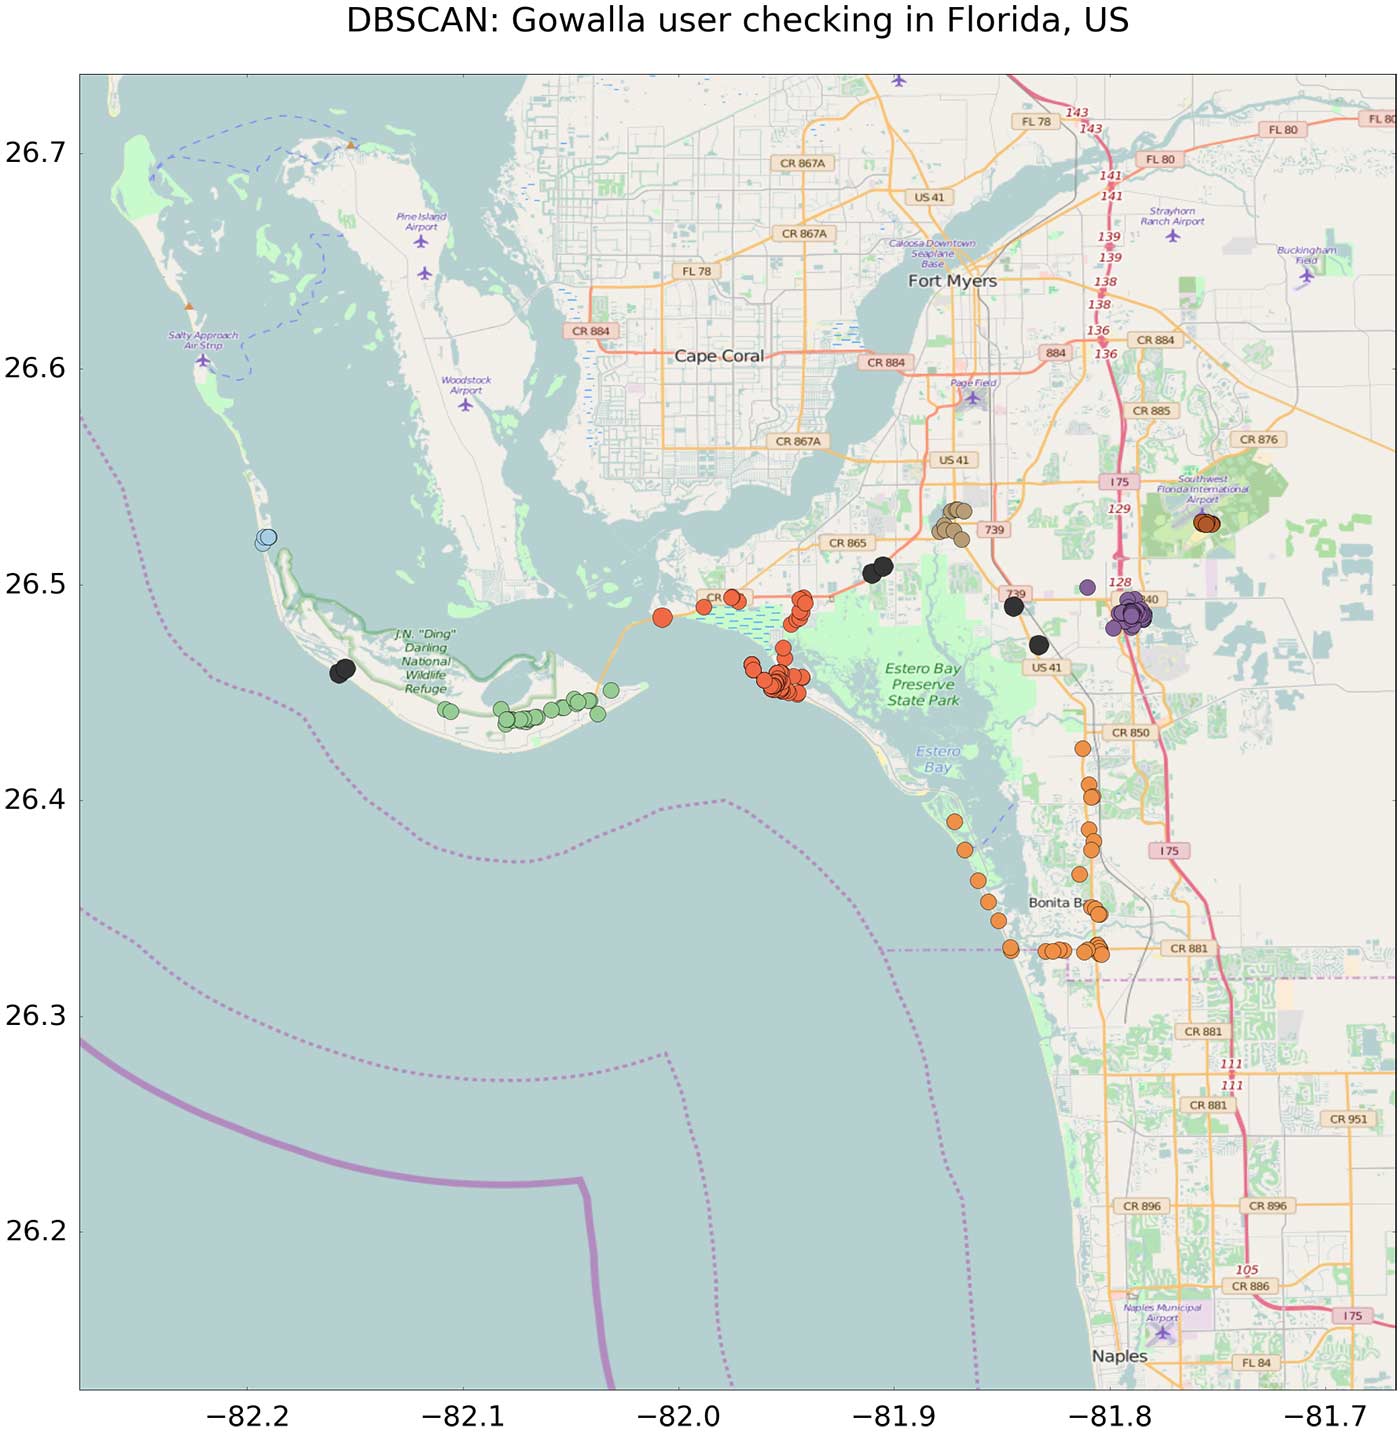
Figure 2 shows an example of clusters extracted from an anonymous user using Gowalla, a social networking site where users share their locations by checking in at specific places. The figure shows a map of Florida, specifically the area of Cape Coral, with the checked venues overlaid as small colored dots.
Events have been clustered according to their geographical position. So, for instance, the hike at Estero Bay (dark orange dots), the venues at the airport (brown dots), and the venues at Sanibel Island (green dots) belong to separate clusters (epsilon set to 3 km, and minPoints set to 3).
Further enhancements to geolocated data analysis
This analysis is centered around geographic coordinates but can easily be extended to other event properties, such as check-in time, venue type (restaurant, gym, museum), or user’s status. The clustering algorithm can also be applied to a larger context by including the events generated by friends in a user’s social networks.
Spark provides a module for SQL data processing that can be used to run queries to filter and collect events before running the clustering algorithm. In this way, the data processing pipeline can be fully implemented on Spark as a unified framework for both SQL and machine learning stages. Such an extended data pipeline would deliver even more accurate clustering results for specific categories of events.
Creating a location-based API service
The result of the clustering analysis produced by Spark can be persisted on a data store table. An API service can query the table and determine for each user if a newly provided geographical point belongs to a known area or not. The API service can then trigger the appropriate actions depending on the use case. For instance, it could message the user with alerts, notifications, or recommendations.
Conclusion
My initial experiments show that Spark provides a solid infrastructure to parallelize and distribute machine learning algorithms on large volumes of users and events. Moreover, Spark accelerates the development of data-driven systems by combining SQL queries and machine learning in a single data processing framework.
The DBSCAN algorithm in combination with Spark appears to be a promising method in which to extract accurate geographical patterns when developing data-driven, location-based applications for a variety of use cases, such as personalized marketing, fraud prevention, and content filtering.