
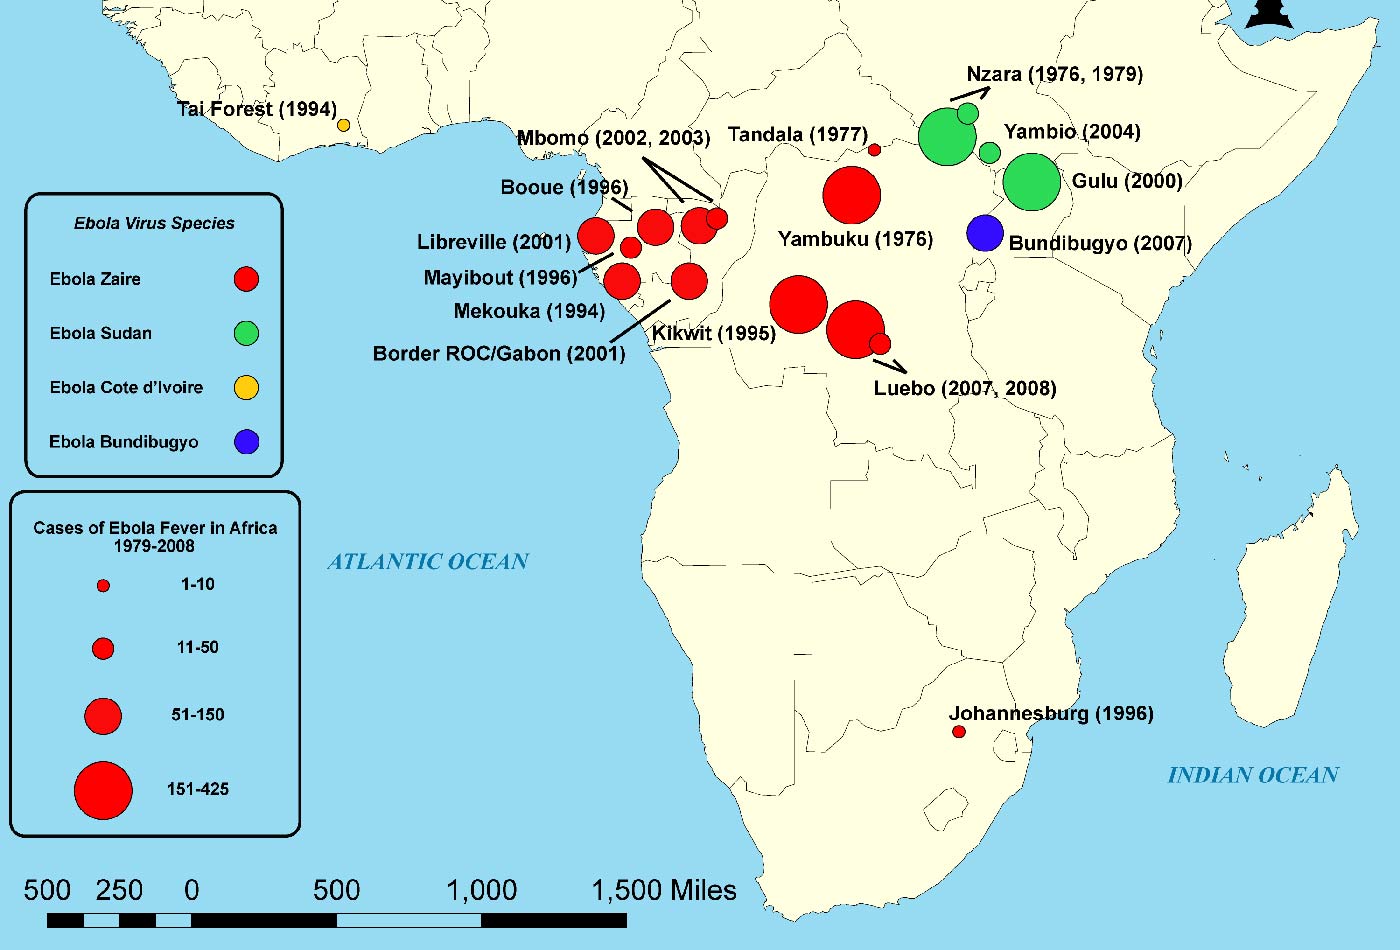
 Map of outbreaks of the Ebola virus in Africa by strain and confirmed contractions. (source: Zorecchi on Wikimedia Commons)
 In this episode, I talk with security architect Efrain Ortiz. We discuss how epidemiology can be applied to infosec, the parallels between using data and patterns to diagnose disease and find endpoint problems, and how to think like an epidemiologist in order to get out of reactive approaches to security at your own organization.
Here are some highlights:
Epidemiological thinking
I started reading books about epidemiology, including one about Dr. John Snow (no relationship to Game of Thrones), who lived in London in the mid-1800s. Back then, everybody thought you got sick from bad smells (miasma theory). In 1854, there was a cholera outbreak in London, and Dr. Snow did something very different, something that hadn’t been done before. He walked around and mapped out when and where somebody died. When he laid out the map, a pattern emerged: there was a water pump in the middle of the recorded deaths that seemed to indicate that drinking from that water pump made people sick. He went to the general board of health and told them they needed to close the pump. The response was basically, ‘No. Can’t do that. There’s no evidence for that.’ Evidence is what we’re lacking in security today as well. We say things about how the boogieman is going to get our computers, but we don’t have a lot of evidence that’s explainable to the layperson or management.
Snow went about finding outliers, finding evidence. The two outliers he found were amazing. Right next to the pump was a brewery, where no one got sick. Then there was a lady who lived about two kilometers away who got cholera. If miasma theory was true, and the bad smell traveled two kilometers to make one person sick, why wasn’t anyone at the brewery impacted? It turns out the brewery folks were drinking beer instead of water from the contaminated pump. Rather than blaming sickness on smells, people investigated the cause by visiting the families of those who died, collecting evidence, and connecting the dots.
Mapping digital disease
Inspired by this, a friend and I decided to build a tool based off the CDC Epi Info tool. These folks (at the CDC) are an epidemic intelligence service. These are the people we hear about in the news. When Ebola breaks out, or another infectious pathogen is spreading, they get deployed.
My friend and I made a web-based app, and we started looking at production logs for a number of different clients and, well, our brains started to explode. We placed the endpoint names on the Y-axis. Then we placed the events, a timeline, on the X-axis and color coded the types of events (a firewall block, a USB getting plugged, auto run that’s running, an update, an endpoint update of AV signatures, IPS signatures, and so on). Lo and behold, we saw patterns. Some of them took us a few weeks to figure out. We noticed that the antivirus updates—the gray dots—were these huge vertical lines with white spots in between. We figured out that they showed people turning their machines off at night. The machine was getting an infection in the middle of the night, but the machine was not getting updates. It happened every night for seven nights straight, and then it stopped getting updates.
Essentially, this machine kept going to the same infected water source, coughing every time it drank from it, and then one day just dropped off, so no one saw it anymore. We had a host that was repeatedly infected, but cleaned because the antivirus detected it. What we later found out when we investigated the endpoint is that it had downloaded. It was going to the well and trying to download updates to its malware and the AV would detect the reused code, but the downloader wasn’t detected. Finally, the machine just dropped off. That’s when the attacker became successful. They had compromised the system, and it was totally off.
Passive vs. active surveying
Passive surveying in epidemiology is when you set up the emergency room and wait for people to come in. When I talk to clients, they’re just basically looking at their endpoint consoles, and when they see the little red dot show up on their “map”, they investigate it, clean it up, or re-image the computer. They’re waiting for the emergency room visits.
Active surveying is when the epidemiologist goes out into the field, like Dr. Snow, to get to know the community. (Who lives where? Where do they eat? Where do they drink? Where do they play? How do they work?) Using active surveying, I’ve been able to see what tools are being used when there’s a security problem.
Instead of waiting for a security vendor to offer a solution, let’s be like John Snow. Let’s actively look for and find that contaminated pump handle, and let’s make a change. But instead of making a wholesale change, like implementing a policy across an entire environment, do what epidemiologists do: test it on a random small sample, do studies. Pick a few people at your organization and apply your desired policy in log-only mode. If management doesn’t want to take action, collect some data. Then you’ll have the evidence that the “board of health” wants and you can show that when you allow the USB to be used in a particular way just so someone can have their training videos work, there is a higher percentage of infection. But if you disabled that capability, there would be a 1% false positive, meaning 1% of the people trying to load their annual training video would not be able to do it correctly, but 60% of the other things—which would have become diseases—were prevented.
Related links:
- Efrain’s series of posts on Epidigitalogy and Digital Disease Control
- David McCandless—Information is Beautiful