Reducing Risk in the Petroleum Industry
Learn the challenges oil and gas companies face when collecting data and how they mitigate short-term operational risk and optimize long-term reservoir management.
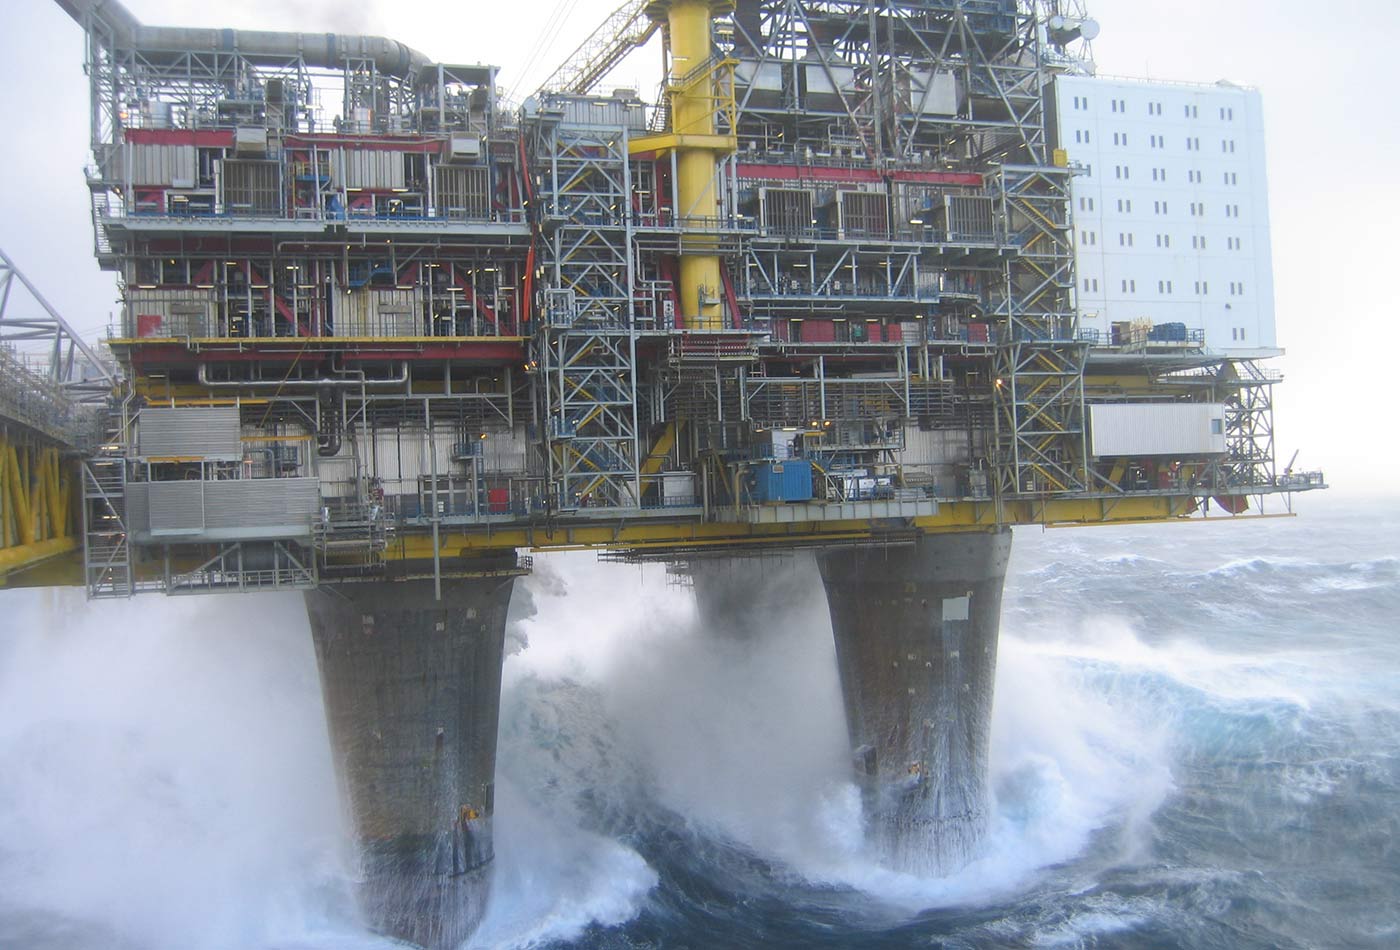 Rig III. (source: Richard Child on Flickr)
Introduction
To the buzzword-weary, Big Data has become the latest in the infinite series of technologies that “change the world as we know it.” But amidst the hype, there is an epochal shift: the current exponential growth in data is unprecedented and is not showing any signs of slowing down.
Compared to the short timelines of technology startups, the long history of the petroleum industry provides stark examples to illustrate this change. Seismic research happens early in the exploration and extraction stages. In 1990, one square kilometer yielded 300 megabytes of seismic data. In 2015, this was 10 petabytes—33 million times more, according to Satyam Priyadarshy, chief data scientist at Halliburton. First principles, intuition, and manual arts are overwhelmed by this volume and variety of data. Data-driven models, however, can derive immense value from this data flood. This report gathers highlights from Strata+Hadoop World conferences that showcase the use of data science to minimize risk in the petroleum industry.

Learn faster. Dig deeper. See farther.
In the short term, data can be used to mitigate operational risk. Given good data, machine learning can be used to optimize well completion parameters such as the amount and type of proppant used. Ben Hamner, chief technology officer at the data science startup, Kaggle, says these are the biggest drivers of well cost and the biggest expense when drilling the well. They also have a proportionate impact on how much a well can produce. Using completion parameters from machine learning on one well, the gain after costs was $700,000.
Priyadarshy shared how pipelining seismic, drilling, and production data can be used for long-term reservoir management. Since it can be expensive to move data from offshore or remote operations, models use the data on site and the results are aggregated with previously collected data and models.
Oliver Mainka (vice president of product management at SAP), Hamner, and Priyadarshy all agree that the quality of data determines the value that can be derived from it. Machines are very good at spotting new patterns in oceans of data. The iterative use of human intelligence to clean the input data and validate results based on experience makes machine data-crunching an effective generator of value. Big or small, using all the available data is justified if it generates value.
Operational Risk
The spectrum of available data can be used to answer a variety of questions. High-quality input data is required for most analyses, and the output data can address different realms, like current operational risk and longer-term organizational challenges.
Here are some examples of addressing operational risk during different stages of the upstream process.
Exploration
Exploration is an exciting time during which there can be immense payback for making the correct choices. The right data and the information that results from this data processing can be valuable tools in the upstream arsenal.
Domain expertise on data sources
The oil and gas industry has been a prolific user of data for a long time, as Chevron’s Martin Waterhouse points out—and just as keeping oil flowing is a complex operation running across continents, keeping information flowing can be just as much of a challenge. Big oil are large companies, but they are not monoliths. They are conglomerations of organizations which can be considered large companies on their own. The culture of the people, the role data plays, and the time that the data is retained can be very different in each organization. It can take years to figure out whom to ask questions, where things are done, and how the company functions. Connecting domain expertise with the latest in modeling and predictive analytics is as important as implementing those models, but the payoff is worth it.
In unconventional production (shale), well production is highly correlated with location. Machine learning can help determine where to acquire acreage. The input data can come from:
- Geology
- Core samples are rich and accurate, but also rare and very expensive
- Drilling and completion
- Amount of proppant and fluid, number of stages, and injection rate
- Production
- Publicly available in the US; varies by state
Garbage in, garbage out applies here just as much as anywhere else. Human intelligence is critical for quality control of data. Domain experts can tell the difference between a bad sensor measurement and slowed production because of transport issues. For good performance, a combination of manual and automated approaches is used to correct data when possible and reject otherwise. Hamner estimates, 95% of the effort in tackling predictive problems in the industry lies in deeply understanding data sources and how they fit into the business use case. A related challenge is how to expose results to key decision-makers.
Integrating disparate data sources
A variety of sources can contribute to the data repository. This can range from automated high-sample-rate sensors to a human dropping a rope in a tank every six months. They can include audio, video, handwritten notes, and text reports. The challenge is to convert these different sample rates, accuracies, accessibilities, costs, and difficulties into a validated, usable form. In a case that (like many others) cuts across both data varieties and domains, André Karpištšenko and his team at Marinexplore Inc. (now PlanetOS) have been working to ease the flow and increase the utility of ocean-related data.
In many parts of the world, risk is synonymous with weather. The advent of inexpensive, robust drones powered by wave and solar energy has made available data that was once impossible to gather (in the eye of a storm) or too expensive (across the Pacific), which can keep us better informed of upcoming weather. This can directly impact planning locations for offshore drilling platforms and shipping routes for oil tankers.
Risk is also equated to uncertainty. In the ocean, no two days are the same and attributes like wind, waves, ocean currents, temperature, and pressure vary depending on location and time. A prompt, easily accessible system is more valuable than one with long data collection and processing times, when delays can render information useless.
When data is democratized, the experts are not isolated anymore. There are no long timelines to process and visualize data. Data streams from sensors, models, and simulations are available to everyone. This can even involve sharing—that often maligned word. Since many data sources (satellites, models, gliders, buoys) are capital-intensive, Marinexplore started sharing public data as a demonstration of using existing resources well. Now, leading companies are thinking about how to better exchange data. Karpištšenko’s aim is a borderless ocean-data analysis world.
Drilling and Production
Over the life of a well, the risk-return equation can be optimized with predictive maintenance. Predictive maintenance, as understood by data folk, uses predictive analytics to understand causation and correlation with millions or even billions of records as a matter of course, and formulates predictions about machine failure in order to proactively service devices instead of relying on isolated inspections. In a compressor, monitoring oil temperatures and vibrations in real time offers direct cost advantages by maximizing utility (service too soon) and minimizing downtime (service too late) by operating until the desired point on the PF curve (potential failure, functional failure). This, says Mainka, can result in big numbers. Even a 0.1% reduction in maintenance costs can translate into millions of dollars saved. For example, in Europe, maintenance cost is estimated to be 450 billion euros. Of this, 300 billion could be addressed by maintenance improvements and 70 billon is lost due to ineffective maintenance.
The methods chosen for data processing should be able to handle the characteristics of the incoming data. Priyadarshy highlights the characteristics of different types of upstream data. During seismic studies, the volume of data is very large, but the velocity is slow and the data does not have to be analyzed in real time. The value is significant because if you wrongly choose the drilling location of a well, it could cost you a few hundred million dollars. The complementary example is during drilling. The volume of data is much smaller compared to seismic studies, but the velocity is faster, and sometimes you have to analyze the data in real time. If predictive models fail, it can be expensive (when a drill bit gets stuck, for example). The value of real-time data in any particular case is significant but not as high as well location.
Sensors in real time
Sensors are becoming more pervasive, but what companies do with them still varies significantly. Mainka offers an example. Consider six data sources, producing trillions of records. Processing all of them as a matter of course, in real time, is new for 98% of companies—even though these are sophisticated companies (Fortune 100, Fortune 500).
Sensor maturity translates to lower cost and improved robustness. Petabytes of data are now collected by millions of sensors. The challenge is how to use this fast enough so that value is not lost due to collection and processing. Karpištšenko shares an example from the early life of Marinexplore: once buoy data was collected and analyzed, it took a customer three months to make a decision. Given that the ocean is highly dynamic, this delay seems to negate the usefulness of the information. Marinexplore’s platform can show measurements from sensors and data from models and simulations (such as daily sea temperatures) in seconds instead of months or years.
Data methods
A few data science methods can be applied verbatim, whereas others require tailoring to suit the petroleum industry. While explaining use cases, the speakers offer a glimpse into their instantiation of this world.
Asset-intensive industries are especially interested in maximizing asset productivity. Mainka describes how either the end user or the manufacturer is involved depending on whether the assets are owned or rented. By looking at billions of records, models can create rules and back-calculate possible root causes of failure. Anomalies can be either good or bad. If good, try to repeat it. If bad, try to avoid it. Multiple rules can be chained together to classify scenarios. In each case, by monitoring future performance, the system can be iteratively improved. When an impending failure is detected, from the perspective of the manufacturer, the next step could be to offer preventative maintenance service for a positive customer experience. The risk of unscheduled maintenance and associated costs can thus be reduced. Organizations that generate the majority of maintenance work orders from preventative and predictive inspections and use sophisticated reliability-based maintenance procedures and tools to increase asset availability have a 27% lower unplanned downtime without any increase in service and maintenance cost.
As with most modeling, machine learning applied to exploration and production can be validated against future performance. Hamner lists the following model evaluation strategies as being useful in picking parameters for deeper study or for selecting between models:
- Random cross-validation
- Test performance with randomly withheld wells. This could be biased when correlation exists between wells.
- Time-based validation
- Use results from existing wells to predict new well performance. This can correct for (1) but is harder in newer plays with not as many wells.
- Spatial validation
- Test performance with held-out geographic areas. This corrects for spatial biases and is applicable in newer plays. This helps quantify acreage evaluation models.
In oil and gas, drilling is based on physics and first principles, with data crunching to generate metrics and evaluate key performance indicators (KPIs). However, using the volumes of data already stored, the goal is to learn, innovate, and move to holistic data-driven analytics in real time. Priyadarshy details the three aspects that make now seem like the right time:
- Hardware
- From a single processor to distributed grid processing
- Data
- From local files to flexible, nonrelational distributed file systems
- Applications
- From one machine, one processor to parallel distributed frameworks
This confluence of developments has made real-time analytics not only possible, but the new normal in industry.
Long-Term Risk
Different aspects of long-term risk require unique approaches and solutions. Practical matters whose value can be quantified, like reservoir management, are better understood than institutional ones, like loss of expertise, whose value is more difficult to quantify.
Practical
The oil and gas industry was one of the first aggregators of large amounts of data. Most of the data challenges in upstream operations revolve around storage. Upstream data is expensive to gather, and it isn’t clear at the time what will be useful in the future. Because companies could use it at some future time for some yet-to-be-determined purpose, they store as much as they can. Chevron has exabytes of such data, according to Waterhouse. The long arc of data analytics in the industry reaches back to the ’80s and ’90s, when Chevron was an early adopter of Cray Supercomputers, used for reservoir modeling. More recently, to maximize production over the long term, reservoir characterization and reservoir simulation both use big data technologies, says Priyadarshy.
Institutional
It is not sufficient to pick the right problem and solve it using good data. It is equally important to share the results among the target population, ensure that the acquired knowledge does not perish, and future decisions are based on what was learned during a given study. Any of these can be more challenging than the others, for unexpected reasons.
As a model of the integration of machine learning with human expertise in materials research, Kai Trepte, lead engineer at Harvard’s clean energy project, explains how building blocks are mixed in computer models and their properties analyzed. The data from this analysis is mined for promising candidates, speeding up the discovery process. In addition, constraints for manufacturing and distribution are added to speed up real-world usage. Combinatorially, 26 promising fragments (from research at Stanford University) resulted in 10 million molecules. Help from human experimentalists and theorists, and data mining and machine learning reduced this number to 2.3 million molecules that required further study. These 2.3 million molecules required 150 million calculations, generating 400 terabytes of data. From that, the yield was about 0.5%.
The compute time for such simulations is very large, so they used an existing open source framework IBM World Computing Grid and Berkeley Open Infrastructure for Network Computing (BOINC) where volunteers donate processing on their devices. With 600,000 volunteers donating 22,000 CPU years, it was equivalent to a 170,000-core supercomputer. This is orders of magnitude higher than what a single, well-funded research team could afford. It is difficult to fathom how long physically making these millions of different molecules and testing them would take. Humans and machines together made this study possible.
But as a general statement in research, whether academic or industrial, there is little funding for data persistence (especially when there aren’t publishable results). In short, most of the data collected during research is lost. By Trepte’s estimate, within five years, 50% of raw data is lost. In 10 years, 95% of data is lost. This is changing. The Materials Genome Initiative has funded accessibility and the infrastructure for data sharing within this field.
In addition to persistence of knowledge, a combination of automated and manual approaches must be used to correct data or, if uncorrectable, to remove them from consideration. Many techniques used by Hamner at Kaggle are based on expertise in data-recording and data-reporting practices, as well as experience with the types of failures that occur in the field. A typical unconventional shale well may be online only for a short time during the first month. It quickly spikes to peak production and then declines with most of the oil extracted within 6–12 months.
In Texas, public reporting of production data is at lease-level, not at well-level. So there can be data corruption where the entire lease’s production is wrongly allocated to one well. This can show up as spikes in production as new wells come online. The risk in not correcting this is that we could wrongly deduce that this is an enormously productive well, which could throw off machine-learning models and related decisions. Another problem is if production was affected because of issues not related to well potential, such as well downtime, or choked production, allocation, or or transportation.
The number of well data points can be small—100 to 10,000—but the cost per data point can reach $10–15 million. So, this requires different data quality control than a Facebook news feed, for instance, where the number of data points is higher but the cost per data point is much lower. One method that has proven to work well in well-productivity prediction is Bayesian additive regression trees (BART). This outputs not just a point estimate of the prediction but the full probability distribution that the model learned.
The petroleum industry doesn’t just include seismic research, drilling, mechanical maintenance, and worldwide logistics. The verticals can extend all the way to the retail customer: Chevron, for example, runs many of its gas stations. They make more money selling merchandise than selling gas. So, optimizing this supply chain and analyzing personal traffic and preferences has the potential for significant value. One way to encourage looking at this is to form innovation zones and create places for people to play and learn. This also helps peer exchanges and securing knowledge within the company.
The challenges of personal behavior aren’t limited to customer behavior analytics: they point within the company as well. One challenge is to get executives to fund longer-term initiatives. For instance, it doesn’t help to only store a week’s worth of logs to study long-flow data anomalies. About a year’s worth will be good. Even if the current constraint is cost, understanding and solving this problem has the potential for significant future returns.
Mired in quarterly financial reports during tough economic times, it might be easier to quantify savings from continuous lowest cost outsourcing and offshoring. But longer-term effects are much harder to quantify and may be unrecoverable. Organizations can lose future data experts due to fewer opportunities for peer expertise exchange because things are done in pieces, probably at different locations.
In lean times, Chevron’s Waterhouse has a few ideas for data specialists:
- Seek alternate areas to add value.
- Practice internally and build communities.
- Encourage outreach.
- Embed or relocate to interesting data roles.
- Learn more about each business area.
Conclusion
Analyzing a core sample of one milliliter currently can yield 100 gigabytes of data. If you add seismic, drilling, and other data, there are exabytes of data that need to be stored in oil fields. Confronted with this, machine-data processing has huge advantages: enormous scale and processing power, no fatigue, and no cultural or other biases other than what is programmed into it. But they cannot completely distinguish between good data and bad data or reasonable and unreasonable results. Human intelligence is crucial to make these distinctions and make the overall system profitable.
Bibliography
- Hamner, Ben. “Machine Learning for Oil Exploration.” Strata + Hadoop World in San Jose 2015. February 17, 2015. Accessed August 4, 2016. http://oreil.ly/2aUHBmZ.
- Karpištšenko, André. “The Ocean’s Big Data Platform.” Strata 2014. February 11, 2014. Accessed August 4, 2016. http://oreil.ly/2aphxeN.
- Mainka, Oliver. “Improving Business Operations with Predictive Maintenance and Service.” Strata + Hadoop World in San Jose 2015. February 17, 2015. Accessed August 4, 2016. http://oreil.ly/2aEc9oj.
- Priyadarshy, Satyam. “Leveraging Big Data and Data Science in Upstream Oil and Gas Industry.” Strata + Hadoop World in San Jose 2015. February 17, 2015. Accessed August 4, 2016. http://oreil.ly/2aRBzCz.
- Trepte, Kai. “Harvard’s Clean Energy Project: Big Data Maps to Renewable Energy.” Strata 2014. February 11, 2014. Accessed August 4, 2016. http://oreil.ly/2aUxcqq.
- Waterhouse, Martin. “Don’t Let Today’s Demands Kill Tomorrow’s Workforce!” Strata + Hadoop World in San Jose 2015. February 17, 2015. Accessed August 4, 2016. http://oreil.ly/2aRD2IK.