Scaling up data frames
New frameworks for interactive business analysis and advanced analytics fuel the rise in tabular data objects.
 Traditional house in Kg Salarom (source: Uwe Aranas)
Long before the advent of “big data,” analysts were building models using tools like R (and its forerunners S/S-PLUS). Productivity hinged on tools that made data wrangling, data inspection, and data modeling convenient. Among R users, this meant proficiency with data frames — objects used to store data matrices that can hold both numeric and categorical data. A data.frame is the data structure consumed by most R analytic libraries.
But not all data scientists use R, nor is R suitable for all data problems. I’ve been watching with interest the growing number of alternative data structures for business analysis and advanced analytics. These new tools are designed to handle much larger data sets and are frequently optimized for specific problems. And they all use idioms that are familiar to data scientists — either SQL-like expressions, or syntax similar to those used for R data.frame or pandas.DataFrame.
As much as I’d like these different projects and tools to coalesce, there are differences in the platforms they inhabit, the use cases they target, and the (business) objectives of their creators. Regardless of their specific features and goals, these emerging tools1 and projects all need data structures that simplify data munging and data analysis — including data alignment, how to handle missing values, standardizing values, and coding categorical variables.
Spark2
As the data processing engine for big data, analytic libraries and features are making their way into Spark, thus objects and data structures that simplify data wrangling and analysis are also beginning to appear. For advanced analytics and machine learning, MLTable is a table-like interface that mimics structures like R data.frame, database tables, or MATLAB’s dataset array. For business analytics (interactive query analysis), SchemaRDD’s are used in relational queries executed in Spark SQL.

At the recent Spark Summit, start-up Adatao unveiled and announced plans to open source Distributed Data Frames (DDF) — objects that were heavily inspired by R data.frame. Adatao developed DDF as part of their pAnalytics and pInsights products, so DDF comes with many utilities for analysis and data wrangling.
R
Inspired by idioms used for R data.frame, Adatao’s DDF can be used from within RStudio. With standard R code3, users can access a collection of highly scalable analytic libraries (the algorithms are executed in Spark).
ddf <- adatao.getDDF("ddf://adatao/flightInfo")
adatao.setMutable(ddf, TRUE)
adatao.dropNA(ddf)
adatao.transform(ddf, "delayed = if(arrdelay > 15, 1, 0)")
# adatao implementation of lm
model <- adatao.lm(delayed ~ distance + deptime + depdelay, data=ddf)
lmpred <- adatao.predict(model, ddf1)
For interactive queries, new R packages dplyr and/or data.table can be used for fast aggregations and joins. dplyr also comes with an operator (%.%) for chaining together data (wrangling) operations.
Python
Among data scientists who use Python, pandas.DataFrame has been an essential tool ever since its release. Over the past few years pandas has become one of the most active open source projects in the data space (266 distinct contributors and counting). But pandas was designed for small to medium sized data sets, and as pandas creator Wes McKinney recently noted, there are many areas for improvement.

One area is scalability. To scale to terabytes of data, a new alternative is GraphLab’s SFrame, a component of a product called GraphLab Create. GraphLab Create targets Python users: it comes with a Python API and detailed examples contained in IPython notebooks. SFrame itself uses syntax that should be easy for pandas users to pick up. There are plans to open source SFrame (and some other components of GraphLab Create) later this year.
# recommender in five lines of Python
import graphlab
data = graphlab.SFrame("s3://my_bucket/my_data.csv")
model = graphlab.recommender.create(data)
model.recommend(data)
model.save("s3://my_bucket/my_model.gl")
Badger

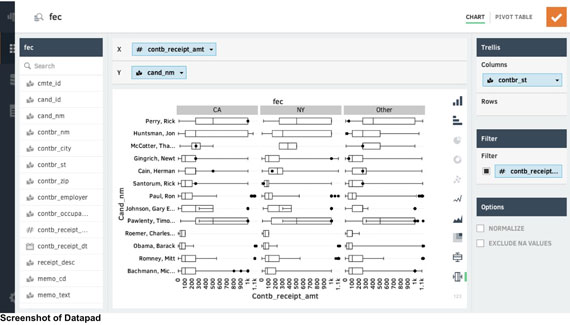
Badger is a new tabular analytics library being built at DataPad — a start-up led and co-founded by Wes McKinney. A C library coupled with a Python-based interface, Badger targets “business analytics and BI use cases” and has a pandas-like syntax, designed for data processing and analytical queries (“more expressive than SQL”). As an in-memory query processor, it features active memory management and caching, and targets interactive speeds on 100-million row and smaller data sets on single machines.

Badger is currently only available as part of DataPad’s visual analysis platform. But its lineage (developed by the team that created pandas) combined with promising performance reports have many Pydata users itching to try it out.
