 Side lever engine (source: Wikimedia Commons)
 By Jeremy Howard, Margit Zwemer and Mike Loukides
In the past few years, we’ve seen many data products based on predictive modeling. These products range from weather forecasting to recommendation engines to services that predict airline flight times more accurately than the airline itself. But these products are still just making predictions, rather than asking what action they want someone to take as a result of a prediction. Prediction technology can be interesting and mathematically elegant, but we need to take the next step. The technology exists to build data products that can revolutionize entire industries. So, why aren’t we building them?
To jump-start this process, we suggest a four-step approach that has already transformed the insurance industry. We call it the Drivetrain Approach, inspired by the emerging field of self-driving vehicles. Engineers start by defining a clear objective: They want a car to drive safely from point A to point B without human intervention. Great predictive modeling is an important part of the solution, but it no longer stands on its own; as products become more sophisticated, it disappears into the plumbing. Someone using Google’s self-driving car is completely unaware of the hundreds (if not thousands) of models and the petabytes of data that make it work. But as data scientists build increasingly sophisticated products, they need a systematic design approach. We don’t claim that the Drivetrain Approach is the best or only method; our goal is to start a dialog within the data science and business communities to advance our collective vision.
Objective-based data products
We are entering the era of data as drivetrain, where we use data not just to generate more data (in the form of predictions), but use data to produce actionable outcomes. That is the goal of the Drivetrain Approach. The best way to illustrate this process is with a familiar data product: search engines. Back in 1997, AltaVista was king of the algorithmic search world. While their models were good at finding relevant websites, the answer the user was most interested in was often buried on page 100 of the search results. Then, Google came along and transformed online search by beginning with a simple question: What is the user’s main objective in typing in a search query?
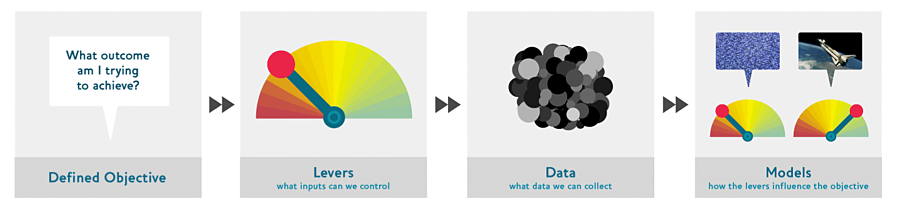
Google realized that the objective was to show the most relevant search result; for other companies, it might be increasing profit, improving the customer experience, finding the best path for a robot, or balancing the load in a data center. Once we have specified the goal, the second step is to specify what inputs of the system we can control, the levers we can pull to influence the final outcome. In Google’s case, they could control the ranking of the search results. The third step was to consider what new data they would need to produce such a ranking; they realized that the implicit information regarding which pages linked to which other pages could be used for this purpose. Only after these first three steps do we begin thinking about building the predictive models. Our objective and available levers, what data we already have and what additional data we will need to collect, determine the models we can build. The models will take both the levers and any uncontrollable variables as their inputs; the outputs from the models can be combined to predict the final state for our objective.
Step 4 of the Drivetrain Approach for Google is now part of tech history: Larry Page and Sergey Brin invented the graph traversal algorithm PageRank and built an engine on top of it that revolutionized search. But you don’t have to invent the next PageRank to build a great data product. We will show a systematic approach to step 4 that doesn’t require a PhD in computer science.
The Model Assembly Line: A case study of Optimal Decisions Group
Optimizing for an actionable outcome over the right predictive models can be a company’s most important strategic decision. For an insurance company, policy price is the product, so an optimal pricing model is to them what the assembly line is to automobile manufacturing. Insurers have centuries of experience in prediction, but as recently as 10 years ago, the insurance companies often failed to make optimal business decisions about what price to charge each new customer. Their actuaries could build models to predict a customer’s likelihood of being in an accident and the expected value of claims. But those models did not solve the pricing problem, so the insurance companies would set a price based on a combination of guesswork and market studies.
This situation changed in 1999 with a company called Optimal Decisions Group (ODG). ODG approached this problem with an early use of the Drivetrain Approach and a practical take on step 4 that can be applied to a wide range of problems. They began by defining the objective that the insurance company was trying to achieve: setting a price that maximizes the net-present value of the profit from a new customer over a multi-year time horizon, subject to certain constraints such as maintaining market share. From there, they developed an optimized pricing process that added hundreds of millions of dollars to the insurers’ bottom lines. [Note: Co-author Jeremy Howard founded ODG.]
ODG identified which levers the insurance company could control: what price to charge each customer, what types of accidents to cover, how much to spend on marketing and customer service, and how to react to their competitors’ pricing decisions. They also considered inputs outside of their control, like competitors’ strategies, macroeconomic conditions, natural disasters, and customer “stickiness.” They considered what additional data they would need to predict a customer’s reaction to changes in price. It was necessary to build this dataset by randomly changing the prices of hundreds of thousands of policies over many months. While the insurers were reluctant to conduct these experiments on real customers, as they’d certainly lose some customers as a result, they were swayed by the huge gains that optimized policy pricing might deliver. Finally, ODG started to design the models that could be used to optimize the insurer’s profit.
The first component of ODG’s Modeler was a model of price elasticity (the probability that a customer will accept a given price) for new policies and for renewals. The price elasticity model is a curve of price versus the probability of the customer accepting the policy conditional on that price. This curve moves from almost certain acceptance at very low prices to almost never at high prices.
The second component of ODG’s Modeler related price to the insurance company’s profit, conditional on the customer accepting this price. The profit for a very low price will be in the red by the value of expected claims in the first year, plus any overhead for acquiring and servicing the new customer. Multiplying these two curves creates a final curve that shows price versus expected profit (see Expected Profit figure, below). The final curve has a clearly identifiable local maximum that represents the best price to charge a customer for the first year.
ODG also built models for customer retention. These models predicted whether customers would renew their policies in one year, allowing for changes in price and willingness to jump to a competitor. These additional models allow the annual models to be combined to predict profit from a new customer over the next five years.
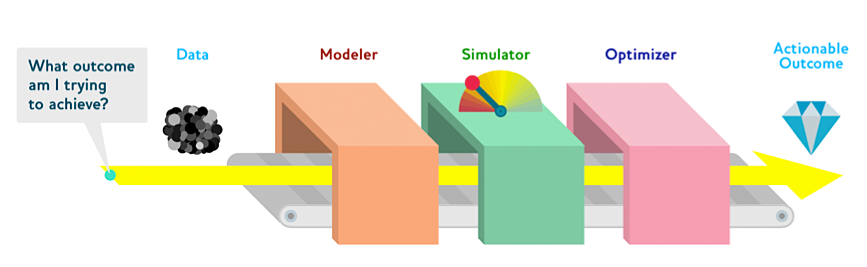
This new suite of models is not a final answer because it only identifies the outcome for a given set of inputs. The next machine on the assembly line is a Simulator, which lets ODG ask the “what if” questions to see how the levers affect the distribution of the final outcome. The expected profit curve is just a slice of the surface of possible outcomes. To build that entire surface, the Simulator runs the models over a wide range of inputs. The operator can adjust the input levers to answer specific questions like, “What will happen if our company offers the customer a low teaser price in year one but then raises the premiums in year two?” They can also explore how the distribution of profit is shaped by the inputs outside of the insurer’s control: “What if the economy crashes and the customer loses his job? What if a 100-year flood hits his home? If a new competitor enters the market and our company does not react, what will be the impact on our bottom line?” Because the simulation is at a per-policy level, the insurer can view the impact of a given set of price changes on revenue, market share, and other metrics over time.
The Simulator’s result is fed to an Optimizer, which takes the surface of possible outcomes and identifies the highest point. The Optimizer not only finds the best outcomes, it can also identify catastrophic outcomes and show how to avoid them. There are many different optimization techniques to choose from (see see sidebar, below), but it is a well-understood field with robust and accessible solutions. ODG’s competitors use different techniques to find an optimal price, but they are shipping the same over-all data product. What matters is that using a Drivetrain Approach combined with a Model Assembly Line bridges the gap between predictive models and actionable outcomes. Irfan Ahmed of CloudPhysics provides a good taxonomy of predictive modeling that describes this entire assembly line process:
“When dealing with hundreds or thousands of individual components models to understand the behavior of the full-system, a ‘search’ has to be done. I think of this as a complicated machine (full-system) where the curtain is withdrawn and you get to model each significant part of the machine under controlled experiments and then simulate the interactions. Note here the different levels: models of individual components, tied together in a simulation given a set of inputs, iterated through over different input sets in a search optimizer.”
Drivetrain Approach to recommender systems
Let’s look at how we could apply this process to another industry: marketing. We begin by applying the Drivetrain Approach to a familiar example, recommendation engines, and then building this up into an entire optimized marketing strategy.
Recommendation engines are a familiar example of a data product based on well-built predictive models that do not achieve an optimal objective. The current algorithms predict what products a customer will like, based on purchase history and the histories of similar customers. A company like Amazon represents every purchase that has ever been made as a giant sparse matrix, with customers as the rows and products as the columns. Once they have the data in this format, data scientists apply some form of collaborative filtering to “fill in the matrix.” For example, if customer A buys products 1 and 10, and customer B buys products 1, 2, 4, and 10, the engine will recommend that A buy 2 and 4. These models are good at predicting whether a customer will like a given product, but they often suggest products that the customer already knows about or has already decided not to buy. Amazon’s recommendation engine is probably the best one out there, but it’s easy to get it to show its warts. Here is a screenshot of the “Customers Who Bought This Item Also Bought” feed on Amazon from a search for the latest book in Terry Pratchett’s “Discworld series:”
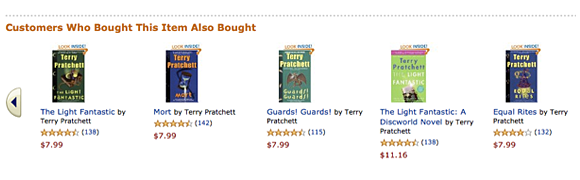
All of the recommendations are for other books in the same series, but it’s a good assumption that a customer who searched for “Terry Pratchett” is already aware of these books. There may be some unexpected recommendations on pages 2 through 14 of the feed, but how many customers are going to bother clicking through?
Instead, let’s design an improved recommendation engine using the Drivetrain Approach, starting by reconsidering our objective. The objective of a recommendation engine is to drive additional sales by surprising and delighting the customer with books he or she would not have purchased without the recommendation. What we would really like to do is emulate the experience of Mark Johnson, CEO of Zite, who gave a perfect example of what a customer’s recommendation experience should be like in a recent TOC talk. He went into Strand bookstore in New York City and asked for a book similar to Toni Morrison’s “Beloved.” The girl behind the counter recommended William Faulkner’s “Absolom Absolom.” On Amazon, the top results for a similar query leads to another book by Toni Morrison and several books by well-known female authors of color. The Strand bookseller made a brilliant but far-fetched recommendation probably based more on the character of Morrison’s writing than superficial similarities between Morrison and other authors. She cut through the chaff of the obvious to make a recommendation that will send the customer home with a new book, and returning to Strand again and again in the future.
This is not to say that Amazon’s recommendation engine could not have made the same connection; the problem is that this helpful recommendation will be buried far down in the recommendation feed, beneath books that have more obvious similarities to “Beloved.” The objective is to escape a recommendation filter bubble, a term which was originally coined by Eli Pariser to describe the tendency of personalized news feeds to only display articles that are blandly popular or further confirm the readers’ existing biases.
As with the AltaVista-Google example, the lever a bookseller can control is the ranking of the recommendations. New data must also be collected to generate recommendations that will cause new sales. This will require conducting many randomized experiments in order to collect data about a wide range of recommendations for a wide range of customers.
The final step in the drivetrain process is to build the Model Assembly Line. One way to escape the recommendation bubble would be to build a Modeler containing two models for purchase probabilities, conditional on seeing or not seeing a recommendation. The difference between these two probabilities is a utility function for a given recommendation to a customer (see Recommendation Engine figure, below). It will be low in cases where the algorithm recommends a familiar book that the customer has already rejected (both components are small) or a book that he or she would have bought even without the recommendation (both components are large and cancel each other out). We can build a Simulator to test the utility of each of the many possible books we have in stock, or perhaps just over all the outputs of a collaborative filtering model of similar customer purchases, and then build a simple Optimizer that ranks and displays the recommended books based on their simulated utility. In general, when choosing an objective function to optimize, we need less emphasis on the “function” and more on the “objective.” What is the objective of the person using our data product? What choice are we actually helping him or her make?
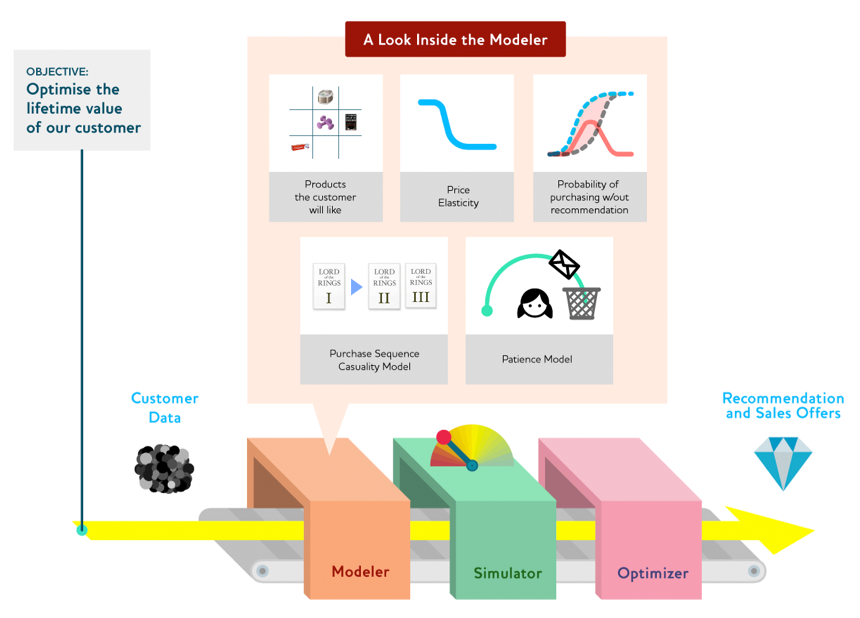
Optimizing lifetime customer value
This same systematic approach can be used to optimize the entire marketing strategy. This encompasses all the interactions that a retailer has with its customers outside of the actual buy-sell transaction, whether making a product recommendation, encouraging the customer to check out a new feature of the online store, or sending sales promotions. Making the wrong choices comes at a cost to the retailer in the form of reduced margins (discounts that do not drive extra sales), opportunity costs for the scarce real-estate on their homepage (taking up space in the recommendation feed with products the customer doesn’t like or would have bought without a recommendation) or the customer tuning out (sending so many unhelpful email promotions that the customer filters all future communications as spam). We will show how to go about building an optimized marketing strategy that mitigates these effects.
As in each of the previous examples, we begin by asking: “What objective is the marketing strategy trying to achieve?” Simple: we want to optimize the lifetime value from each customer. Second question: “What levers do we have at our disposal to achieve this objective?” Quite a few. For example:
- We can make product recommendations that surprise and delight (using the optimized recommendation outlined in the previous section).
- We could offer tailored discounts or special offers on products the customer was not quite ready to buy or would have bought elsewhere.
- We can even make customer-care calls just to see how the user is enjoying our site and make them feel that their feedback is valued.
What new data do we need to collect? This can vary case by case, but a few online retailers are taking creative approaches to this step. Online fashion retailer Zafu shows how to encourage the customer to participate in this collection process. Plenty of websites sell designer denim, but for many women, high-end jeans are the one item of clothing they never buy online because it’s hard to find the right pair without trying them on. Zafu’s approach is not to send their customers directly to the clothes, but to begin by asking a series of simple questions about the customers’ body type, how well their other jeans fit, and their fashion preferences. Only then does the customer get to browse a recommended selection of Zafu’s inventory. The data collection and recommendation steps are not an add-on; they are Zafu’s entire business model — women’s jeans are now a data product. Zafu can tailor their recommendations to fit as well as their jeans because their system is asking the right questions.

Starting with the objective forces data scientists to consider what additional models they need to build for the Modeler. We can keep the “like” model that we have already built as well as the causality model for purchases with and without recommendations, and then take a staged approach to adding additional models that we think will improve the marketing effectiveness. We could add a price elasticity model to test how offering a discount might change the probability that the customer will buy the item. We could construct a patience model for the customers’ tolerance for poorly targeted communications: When do they tune them out and filter our messages straight to spam? (“If Hulu shows me that same dog food ad one more time, I’m gonna stop watching!”) A purchase sequence causality model can be used to identify key “entry products.” For example, a pair of jeans that is often paired with a particular top, or the first part of a series of novels that often leads to a sale of the whole set.
Once we have these models, we construct a Simulator and an Optimizer and run them over the combined models to find out what recommendations will achieve our objectives: driving sales and improving the customer experience.
Best practices from physical data products
It is easy to stumble into the trap of thinking that since data exists somewhere abstract, on a spreadsheet or in the cloud, that data products are just abstract algorithms. So, we would like to conclude by showing you how objective-based data products are already a part of the tangible world. What is most important about these examples is that the engineers who designed these data products didn’t start by building a neato robot and then looking for something to do with it. They started with an objective like, “I want my car to drive me places,” and then designed a covert data product to accomplish that task. Engineers are often quietly on the leading edge of algorithmic applications because they have long been thinking about their own modeling challenges in an objective-based way. Industrial engineers were among the first to begin using neural networks, applying them to problems like the optimal design of assembly lines and quality control. Brian Ripley’s seminal book on pattern recognition gives credit for many ideas and techniques to largely forgotten engineering papers from the 1970s.
When designing a product or manufacturing process, a drivetrain-like process followed by model integration, simulation and optimization is a familiar part of the toolkit of systems engineers. In engineering, it is often necessary to link many component models together so that they can be simulated and optimized in tandem. These firms have plenty of experience building models of each of the components and systems in their final product, whether they’re building a server farm or a fighter jet. There may be one detailed model for mechanical systems, a separate model for thermal systems, and yet another for electrical systems, etc. All of these systems have critical interactions. For example, resistance in the electrical system produces heat, which needs to be included as an input for the thermal diffusion and cooling model. That excess heat could cause mechanical components to warp, producing stresses that should be inputs to the mechanical models.
The screenshot below is taken from a model integration tool designed by Phoenix Integration. Although it’s from a completely different engineering discipline, this diagram is very similar to the Drivetrain Approach we’ve recommended for data products. The objective is clearly defined: build an airplane wing. The wing box includes the design levers like span, taper ratio and sweep. The data is in the wing materials’ physical properties; costs are listed in another tab of the application. There is a Modeler for aerodynamics and mechanical structure that can then be fed to a Simulator to produce the Key Wing Outputs of cost, weight, lift coefficient and induced drag. These outcomes can be fed to an Optimizer to build a functioning and cost-effective airplane wing.
As predictive modeling and optimization become more vital to a wide variety of activities, look out for the engineers to disrupt industries that wouldn’t immediately appear to be in the data business. The inspiration for the phrase “Drivetrain Approach,” for example, is already on the streets of Mountain View. Instead of being data driven, we can now let the data drive us.
Suppose we wanted to get from San Francisco to the Strata 2012 Conference in Santa Clara. We could just build a simple model of distance / speed-limit to predict arrival time with little more than a ruler and a road map. If we want a more sophisticated system, we can build another model for traffic congestion and yet another model to forecast weather conditions and their effect on the safest maximum speed. There are plenty of cool challenges in building these models, but by themselves, they do not take us to our destination. These days, it is trivial to use some type of heuristic search algorithm to predict the drive times along various routes (a Simulator) and then pick the shortest one (an Optimizer) subject to constraints like avoiding bridge tolls or maximizing gas mileage. But why not think bigger? Instead of the femme-bot voice of the GPS unit telling us which route to take and where to turn, what would it take to build a car that would make those decisions by itself? Why not bundle simulation and optimization engines with a physical engine, all inside the black box of a car?
Let’s consider how this is an application of the Drivetrain Approach. We have already defined our objective: building a car that drives itself. The levers are the vehicle controls we are all familiar with: steering wheel, accelerator, brakes, etc. Next, we consider what data the car needs to collect; it needs sensors that gather data about the road as well as cameras that can detect road signs, red or green lights, and unexpected obstacles (including pedestrians). We need to define the models we will need, such as physics models to predict the effects of steering, braking and acceleration, and pattern recognition algorithms to interpret data from the road signs.
As one engineer on the Google self-driving car project put it in a recent Wired article, “We’re analyzing and predicting the world 20 times a second.” What gets lost in the quote is what happens as a result of that prediction. The vehicle needs to use a simulator to examine the results of the possible actions it could take. If it turns left now, will it hit that pedestrian? If it makes a right turn at 55 mph in these weather conditions, will it skid off the road? Merely predicting what will happen isn’t good enough. The self-driving car needs to take the next step: after simulating all the possibilities, it must optimize the results of the simulation to pick the best combination of acceleration and braking, steering and signaling, to get us safely to Santa Clara. Prediction only tells us that there is going to be an accident. An optimizer tells us how to avoid accidents.
Improving the data collection and predictive models is very important, but we want to emphasize the importance of beginning by defining a clear objective with levers that produce actionable outcomes. Data science is beginning to pervade even the most bricks-and-mortar elements of our lives. As scientists and engineers become more adept at applying prediction and optimization to everyday problems, they are expanding the art of the possible, optimizing everything from our personal health to the houses and cities we live in. Models developed to simulate fluid dynamics and turbulence have been applied to improving traffic and pedestrian flows by using the placement of exits and crowd control barriers as levers. This has improved emergency evacuation procedures for subway stations and reduced the danger of crowd stampedes and trampling during sporting events. Nest is designing smart thermostats that learn the home-owner’s temperature preferences and then optimizes their energy consumption. For motor vehicle traffic, IBM performed a project with the city of Stockholm to optimize traffic flows that reduced congestion by nearly a quarter, and increased the air quality in the inner city by 25%. What is particularly interesting is that there was no need to build an elaborate new data collection system. Any city with metered stoplights already has all the necessary information; they just haven’t found a way to suck the meaning out of it.
In another area where objective-based data products have the power to change lives, the CMU extension in Silicon Valley has an active project for building data products to help first responders after natural or man-made disasters. Jeannie Stamberger of Carnegie Mellon University Silicon Valley explained to us many of the possible applications of predictive algorithms to disaster response, from text-mining and sentiment analysis of tweets to determine the extent of the damage, to swarms of autonomous robots for reconnaissance and rescue, to logistic optimization tools that help multiple jurisdictions coordinate their responses. These disaster applications are a particularly good example of why data products need simple, well-designed interfaces that produce concrete recommendations. In an emergency, a data product that just produces more data is of little use. Data scientists now have the predictive tools to build products that increase the common good, but they need to be aware that building the models is not enough if they do not also produce optimized, implementable outcomes.
The future for data products
We introduced the Drivetrain Approach to provide a framework for designing the next generation of great data products and described how it relies at its heart on optimization. In the future, we hope to see optimization taught in business schools as well as in statistics departments. We hope to see data scientists ship products that are designed to produce desirable business outcomes. This is still the dawn of data science. We don’t know what design approaches will be developed in the future, but right now, there is a need for the data science community to coalesce around a shared vocabulary and product design process that can be used to educate others on how to derive value from their predictive models. If we do not do this, we will find that our models only use data to create more data, rather than using data to create actions, disrupt industries and transform lives.
Do we want products that deliver data, or do we want products that deliver results based on data? Jeremy Howard examined these questions in his Strata CA 12 session, “From Predictive Modelling to Optimization: The Next Frontier.” Full video from that session is embedded below:
Related:
- Free download: “Designing Great Data Products” (PDF, EPUB, Mobi formats)
- The evolution of data products