CHAPTER 6
Trends
The trend is your friend except at the end when it bends.
—Ed Seykota
■ Defining Trends by Highs and Lows
One standard definition of an uptrend is a succession of higher highs and higher lows. For example, during the May 2014–March 2015 period in Figure 6.1, each relative high (RH) is higher than the preceding high, and each relative low (RL) is higher than the preceding low. In essence, an uptrend can be considered intact until a previous reaction low point is broken. A violation of this condition serves as a warning signal that the trend may be over. For example, in Figure 6.1, the late April penetration of the early April relative low confirmed the end of the nearly yearlong rally, after which the market entered an extended trading range (see weekly chart inset). Figure 6.2 provides an intraday example of an uptrend defined by successively higher highs and higher lows. It should be emphasized, however, that the disruption of the pattern of higher highs and higher lows (or lower highs and lower lows) should be viewed as a clue, not a conclusive indicator, of a possible long-term trend reversal.
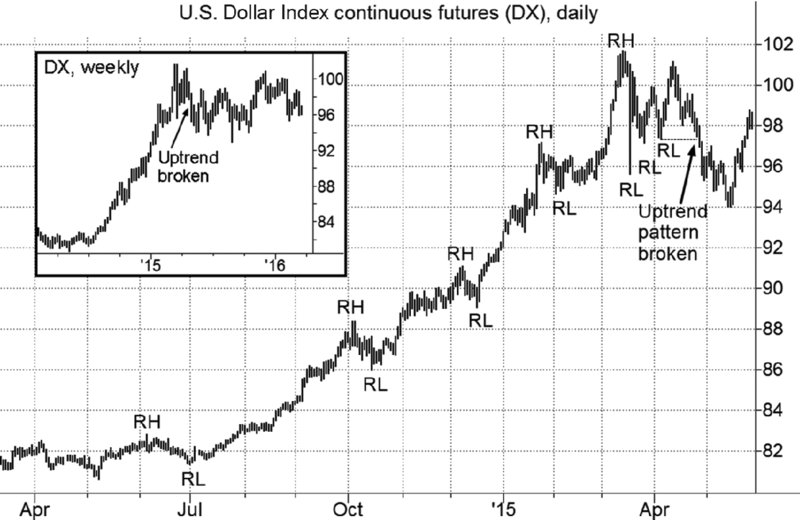
Figure 6.1 Uptrend as Succession of Higher Highs and Higher Lows: Dollar Index Continuous Futures
Note: RH = relative high; RL = relative low.
Chart created using TradeStation. ©TradeStation Technologies, Inc. All rights reserved.
Figure 6.2 Uptrend as Succession ...
Get A Complete Guide to the Futures Market, 2nd Edition now with the O’Reilly learning platform.
O’Reilly members experience books, live events, courses curated by job role, and more from O’Reilly and nearly 200 top publishers.

