CHAPTER 22
Supply-Demand Analysis: Basic Economic Theory:
There are in the fields of economics no consistent relations, and consequently, no measurement is possible.
—Ludwig Edler von Mises
■ Supply and Demand Defined
Supply curves slope upward, meaning more is offered to the market at higher prices (Figure 22.1).1 Assuming that the time unit shown on the horizontal axis in Figure 22.1 equals one season, the supply that can be offered to the market will be limited to total production plus stocks, regardless of the price. At high prices, however, producers will be willing to hold smaller inventories and therefore offer greater quantities to the market. Conversely, at lower prices, producers will prefer to store larger quantities rather than marketing their goods at prevailing depressed levels. The slope of the supply curve will reflect this tradeoff between the options of sale and storage.2
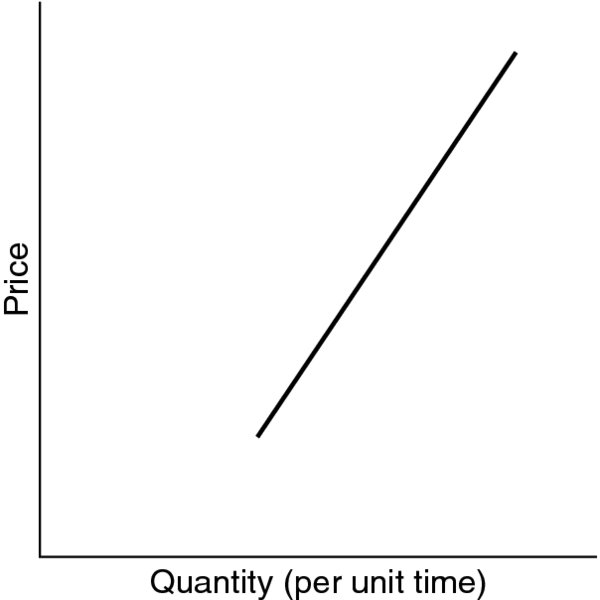
Figure 22.1 Supply Curve
For perishable (e.g., eggs, potatoes3) or nonstorable (e.g., cattle, hogs) commodities, supply is approximately fixed and can be represented by a vertical line (Figure 22.2). For example, if a supply curve is drawn for the hog market for a time unit of one-half year, the amount offered to the market during that period will be relatively independent of market prices. Low prices will not reduce the quantity supplied, because once hogs reach market weight, with ...
Get A Complete Guide to the Futures Market, 2nd Edition now with the O’Reilly learning platform.
O’Reilly members experience books, live events, courses curated by job role, and more from O’Reilly and nearly 200 top publishers.

