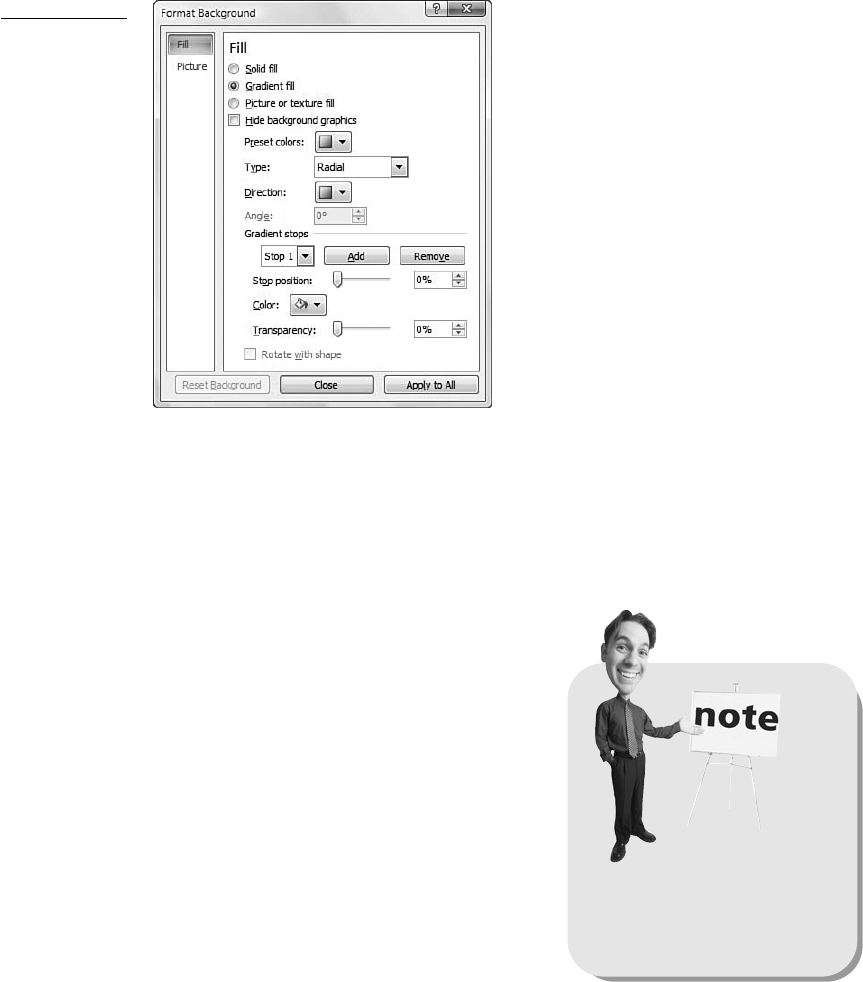
Format Background option. This displays the Format Background dialog box, shown
in Figure 17.3, where you can choose from various types of fill and picture back-
grounds.
208
ABSOLUTE BEGINNER’S GUIDE TO COMPUTER BASICS
FIGURE 17.3
Use the Format
Background dia-
log box to apply
sophisticated
slide back-
grounds.
Adding Graphics
An all-text presentation is a little boring. To spice up your slides, you need to add
some graphics!
Inserting Pictures
You can insert any type of drawing or photograph
into a PowerPoint slide. It’s easiest to start with a
slide layout that anticipates the addition of a pic-
ture, however. Follow these steps:
1. From a blank slide, go to the Slides section
of the Ribbon and click the Layout button;
then select the Title and Content layout.
This formats the slide as shown in Figure
17.4, ready to accept different types of
content.
2. To add clip art to the slide, click the Clip
Art icon; then search for the clip art you
want from the Clip Art pane.
In PowerPoint 2003,
select Format, Slide Layout
to display the Slide Layout pane;
select a slide layout from this
pane.
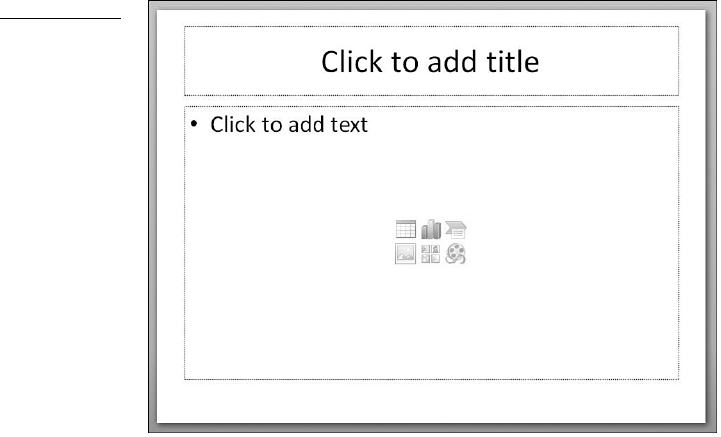
FIGURE 17.4
A slide format-
ted with the Title
and Content
layout.
CHAPTER 17 PRESENTING YOURSELF: WORKING WITH MICROSOFT POWERPOINT
209
3. To add a picture to your slide, click the Insert Picture from File icon; then
navigate to and select a specific picture.
4. To add icons, buttons, and similar graphics to your slide, click the Insert
SmallArt Graphic icon; then select a graphic from the resulting dialog box.
After the graphic is added, you can now format it in a number of ways. To rotate the
graphic, grab the green handle above the graphic and turn it to the left or right. To
recolor the graphic, add a border style, insert a drop shadow, or crop the graphic,
select the Design Ribbon and use the options there.
Creating Charts
Another way to spice up your presentation is to display numerical data in chart for-
mat, as shown in Figure 17.5. The easiest way to create a chart in PowerPoint 2007
is to start with the Title and Content slide layout and then follow these steps:
1. Click the chart icon.
2. When the Insert Chart dialog box appears, choose a chart type.
3. An Excel spreadsheet now opens onscreen. Enter the data for your chart into
this spreadsheet and close the spreadsheet when you’re finished.
4. Your chart now appears on the slide. Select the Design Ribbon to select a dif-
ferent chart layout or style, or use the Layout Ribbon to format different
aspects of the chart.
Get Absolute Beginner’s Guide to Computer Basics, Fourth Edition now with the O’Reilly learning platform.
O’Reilly members experience books, live events, courses curated by job role, and more from O’Reilly and nearly 200 top publishers.

