ADOBE FLEX BUILDER 3
Using Adobe Flex Builder 3
19
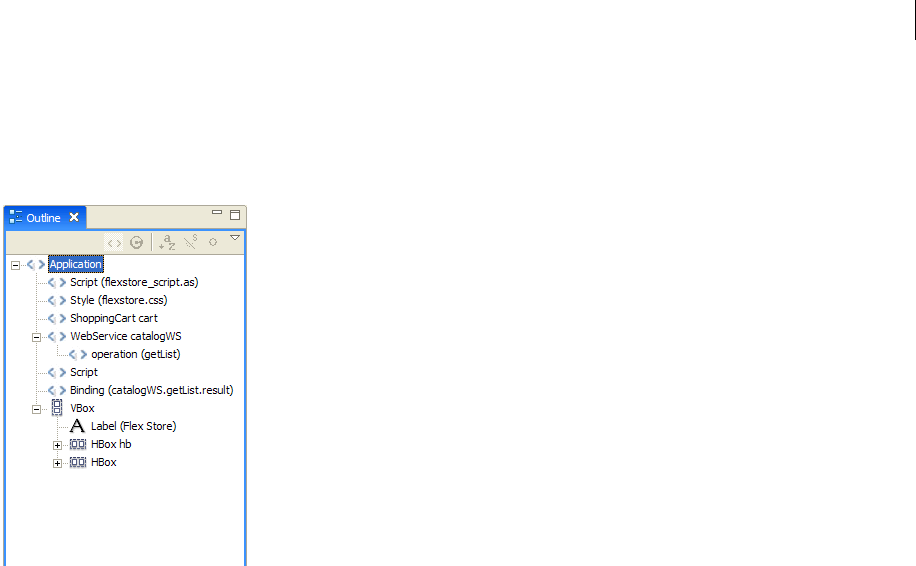
Outline view
In Design mode, the Outline view presents a hierarchical view of the MXML structure of your Flex applications. You
can easily navigate the structure of your application by selecting individual MXML tag statements and components.
When you select an item in the Outline view, it is highlighted in Design mode.
For more information about working with the Outline view in Design mode, see “Inspecting the structure of your
MXML” on page 77.
The Flex Debugging perspective
The Flex Debugging perspective contains the tools you need to debug your Flex and ActionScript applications. Like
the Development perspective, the primary tool within the debugging perspective is the editor. In the context of
debugging your applications, the editor works with the debugging tools to locate and highlight lines of code that need
attention so that you can fix them and continue testing your application.
ADOBE FLEX BUILDER 3
Using Adobe Flex Builder 3
20
For example, you can set breakpoints in your script to stop the execution of the script so that you can inspect the
values of variables and other information up to that point. You can also move to the next breakpoint or step in to a
function call to see the variable values change.
The Debugging perspective appears automatically when the first breakpoint is reached. You can also switch to the
Debugging perspective manually by selecting it from the Perspective bar, which is located at the right edge of the
main workbench toolbar.
The Debugging perspective contains Debug, Breakpoints, Console, Variables, and Expressions views.
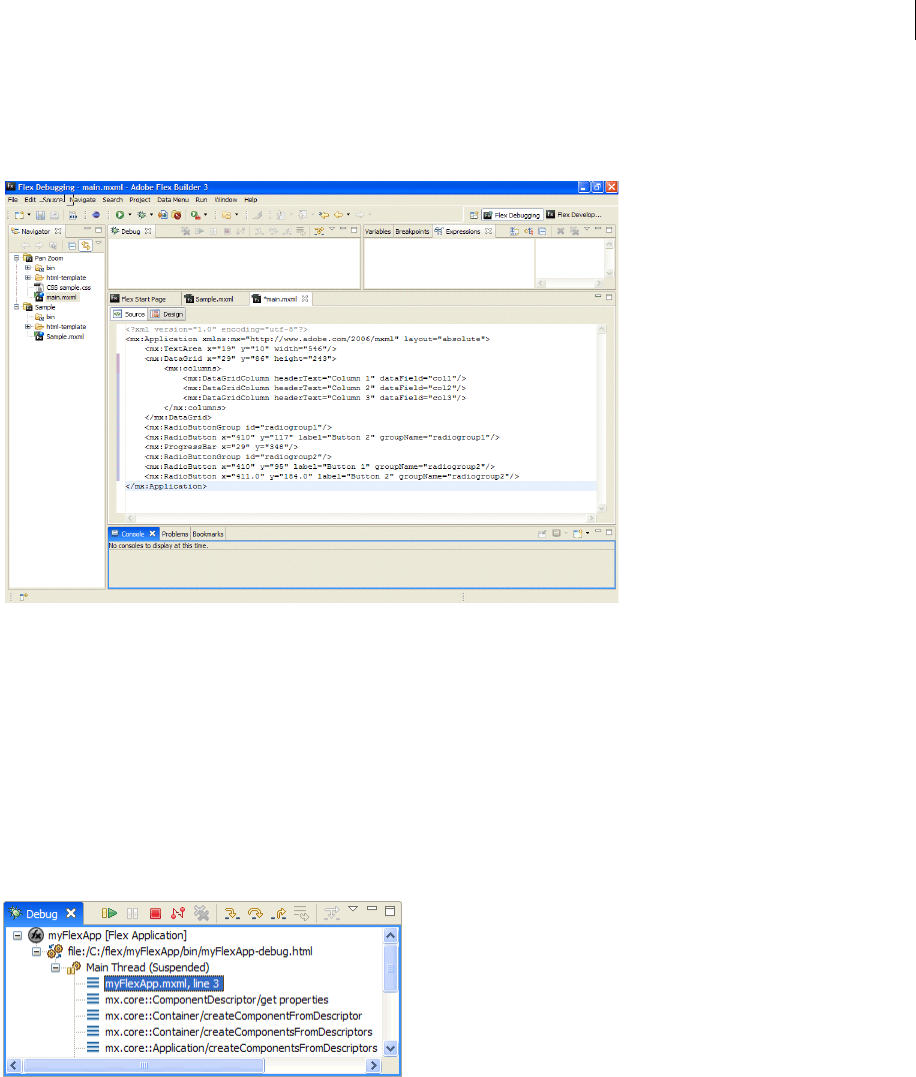
Debug view
The Debug view (in other debuggers this is sometimes referred to as the callstack) displays the stack frame of the
suspended thread of the Flex application you are debugging. You use the Debug view to manage the debugging
process. For example, the Debug view allows you to resume or suspend the thread, step into and over code state-
ments, and so on.
For more information about working with the Debug view, see “Managing the debugging session in the Debug view”
on page 143.
Flex applications are single-threaded (not multithreaded like Java, for example) and you can debug only one Flex
application at a time. Therefore, when you debug a Flex application, you see only the processes and Debug view for
a single thread of execution.
ADOBE FLEX BUILDER 3
Using Adobe Flex Builder 3
21
The Debug view shows a list of all the functions called to that point, in the order called. For example, the first
function called is at the bottom of the list. You can double-click a function to move to it in the script; Flex Builder
updates the information in the Variables view to reflect the new location in the script.
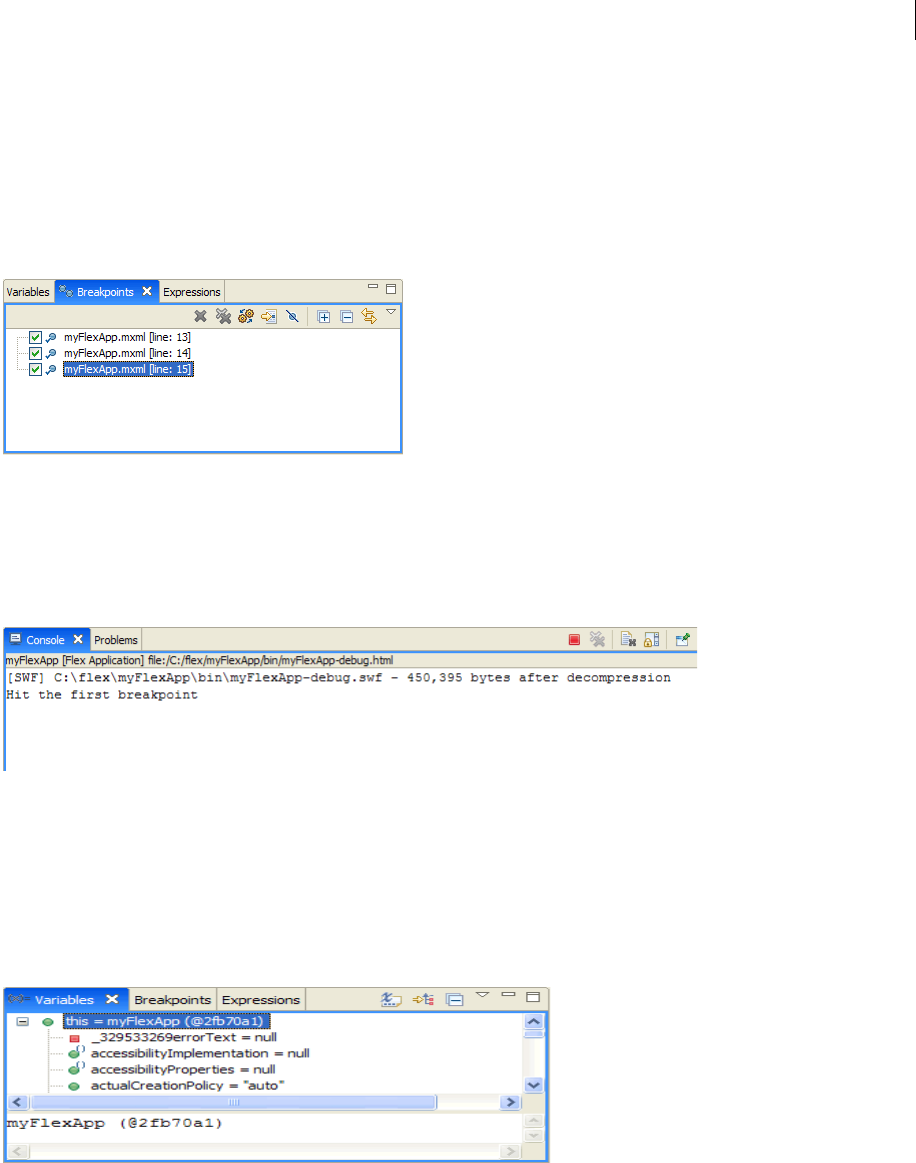
Breakpoints view
The Breakpoints view lists all of the breakpoints you set in your project. You can double-click a breakpoint and
display its location in the editor. You can also disable, skip, and remove breakpoints.
For more information, see “Managing breakpoints in the Breakpoints view” on page 143.
Console view
The Console view displays the output from trace statements placed in your ActionScript code and also feedback from
the debugger itself (status, warnings, and errors).
For more information, see “Using the Console view” on page 144.
Variables view
The Variables view displays information about the variables in a selected stack frame. You can select variables to
monitor (in the Expressions view) and also change variable values during the debugging session. During the debug
session you can see the changes in the currently running SWF file and experiment with fixes for the problem you
need to resolve.
For more information, see “Managing variables in the Variables view” on page 144.
Get ADOBE® FLEX® BUILDER™ 3: USING ADOBE FLEX BUILDER 3 now with the O’Reilly learning platform.
O’Reilly members experience books, live events, courses curated by job role, and more from O’Reilly and nearly 200 top publishers.

