February 2013
Beginner to intermediate
176 pages
3h 22m
English
The Bollinger band (BB) is another very important technical indicator. It is represented by the red lines on the chart in Figure 5.1. The bands are plotted at two standard deviations above and below M2 (green). When using two standard deviations, we know that 95 percent of the price data (the line chart of the stock) will fall between the two Bollinger bands. In this chapter we study in greater detail how the line chart will travel between the Bollinger bands and M1 (white) and why this is a vital indicator to increase our profits.
FIGURE 5.1 Chart of FULT—UBB, LBB
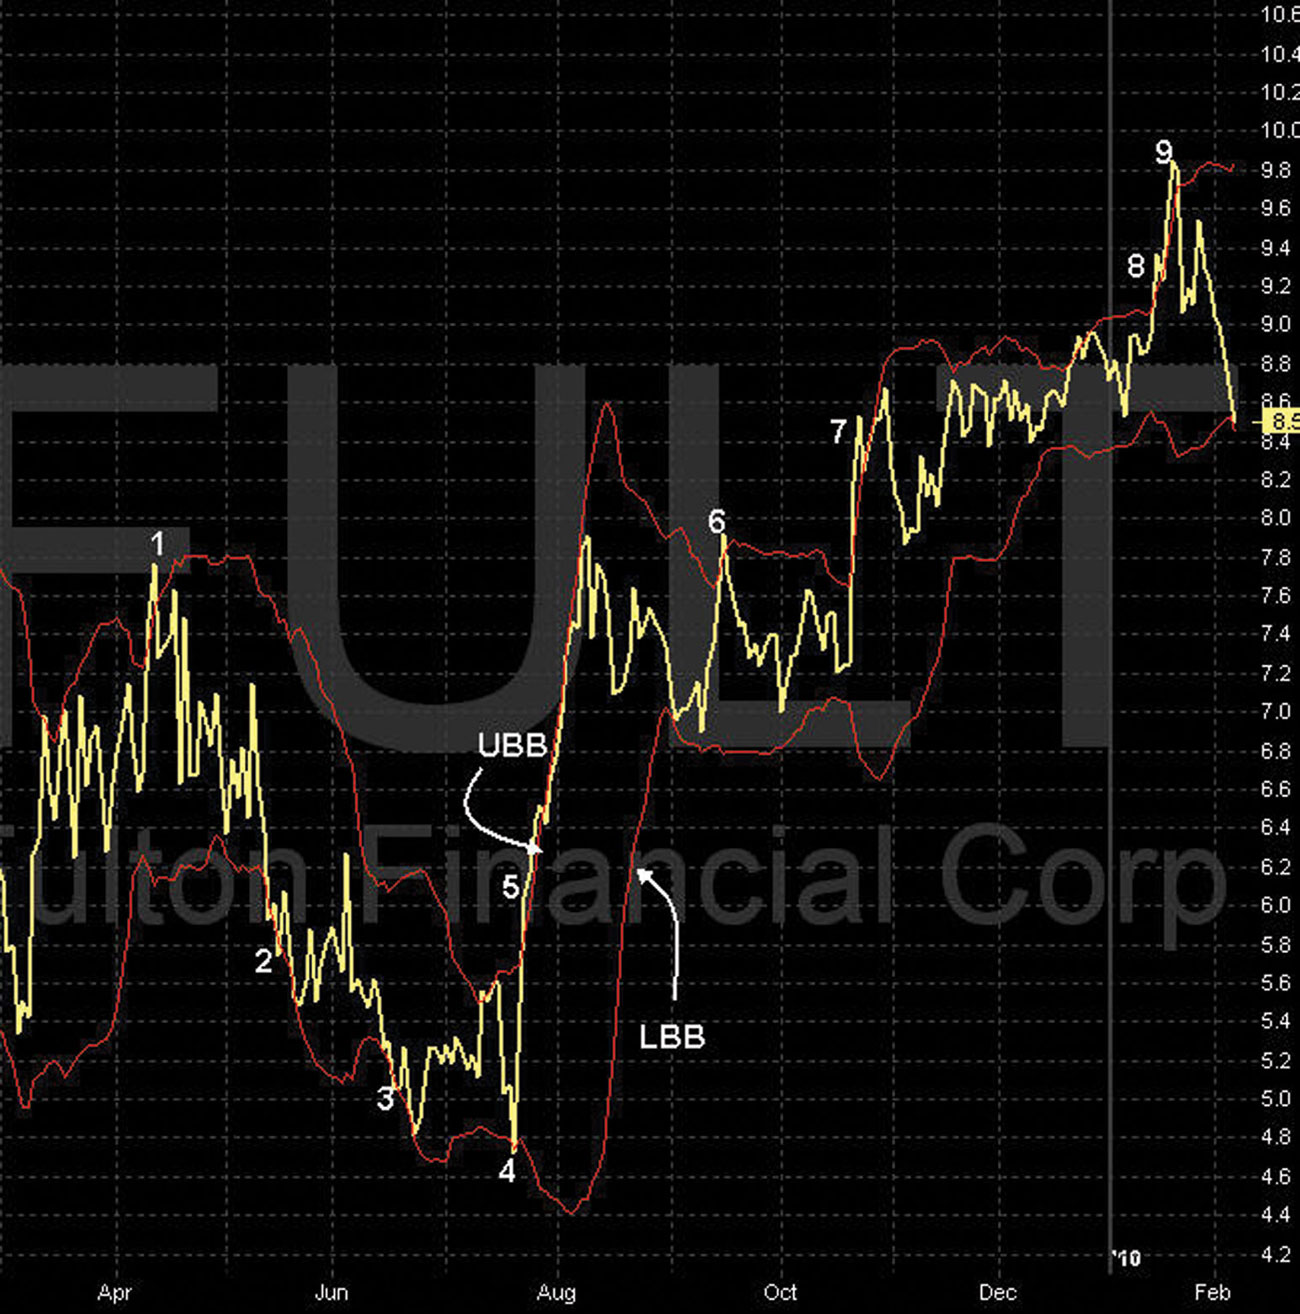
In Figure 5.1, the upper red line is called the upper ...
Read now
Unlock full access


