February 2013
Beginner to intermediate
176 pages
3h 22m
English
Thus far we have studied all of the upper chart indicators. Let us now review them and put them all together.
Figure 6.1 shows the relationship of the line chart, M1, M2, M3, and the Bollinger bands (BBs). Once you have looked at hundreds, if not thousands, of charts, you will begin to recognize exactly what these technical indicators mean.
FIGURE 6.1 Chart of CCL—MAs and BBs Stacked Up
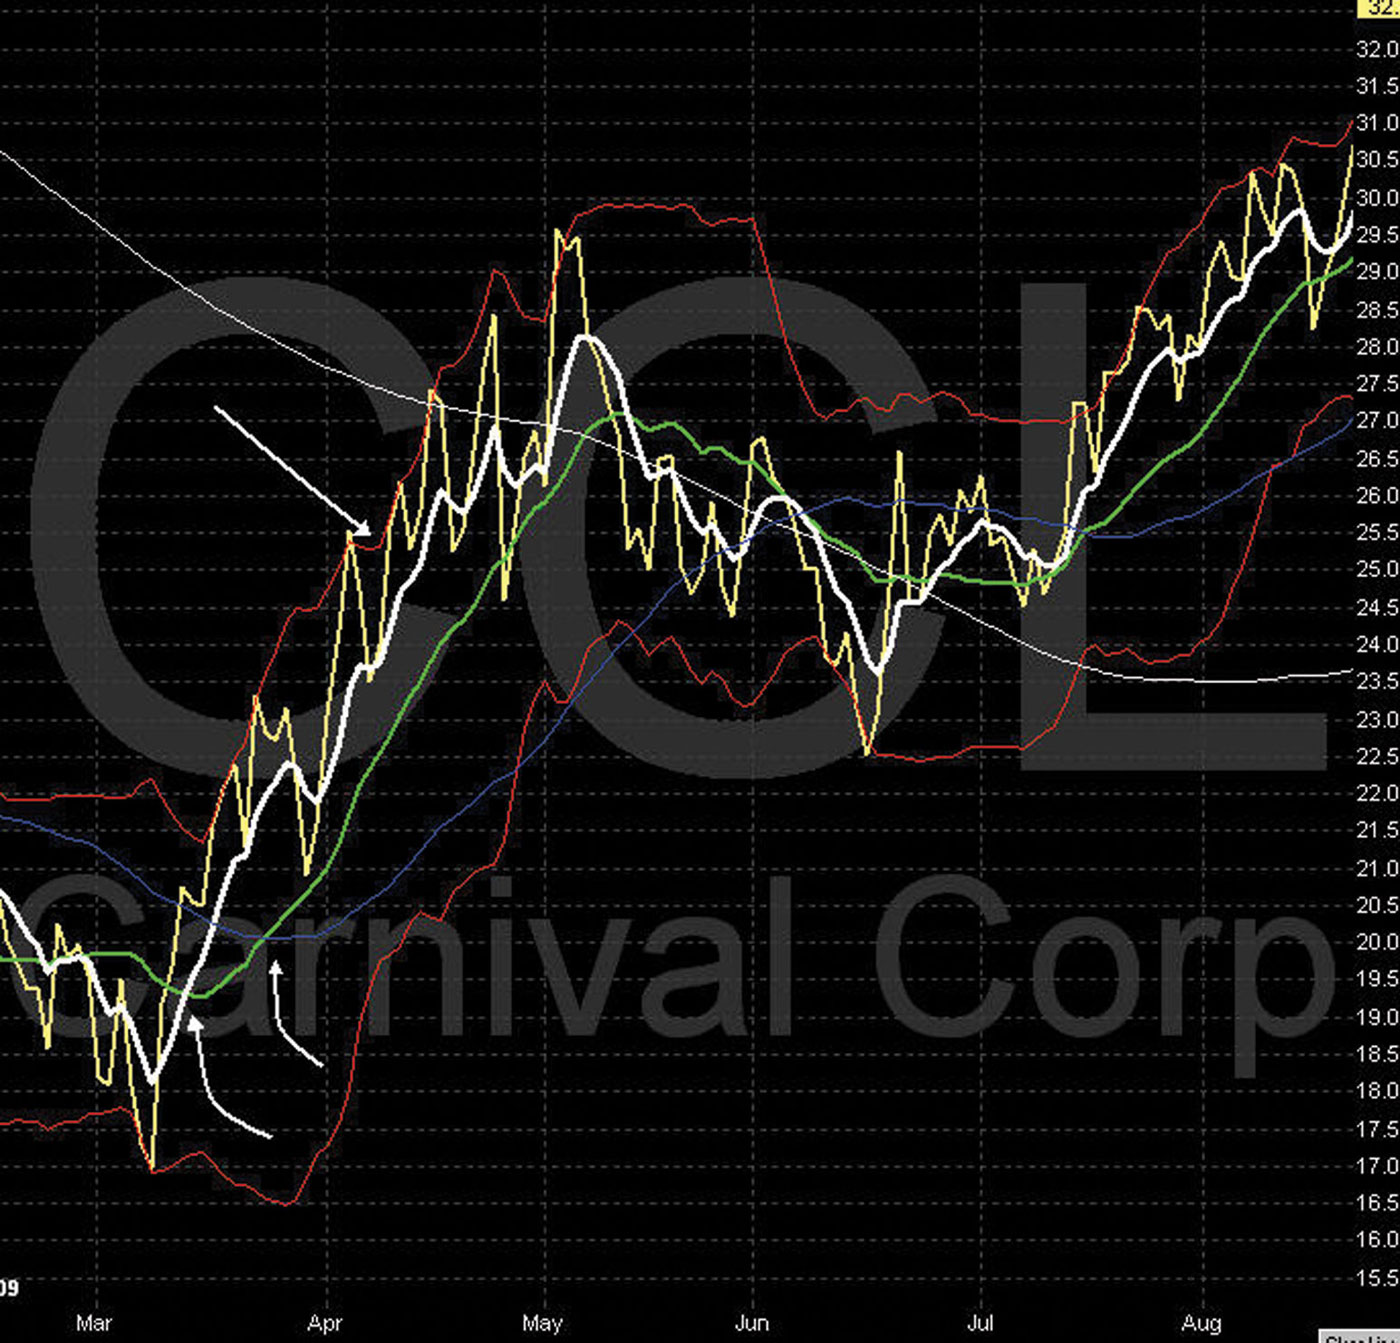
Note that in mid-March, M1 turns up and crosses over M2. M2 turns up and follows M1 and crosses M3. The stacked-up formation indicates strong upward momentum.
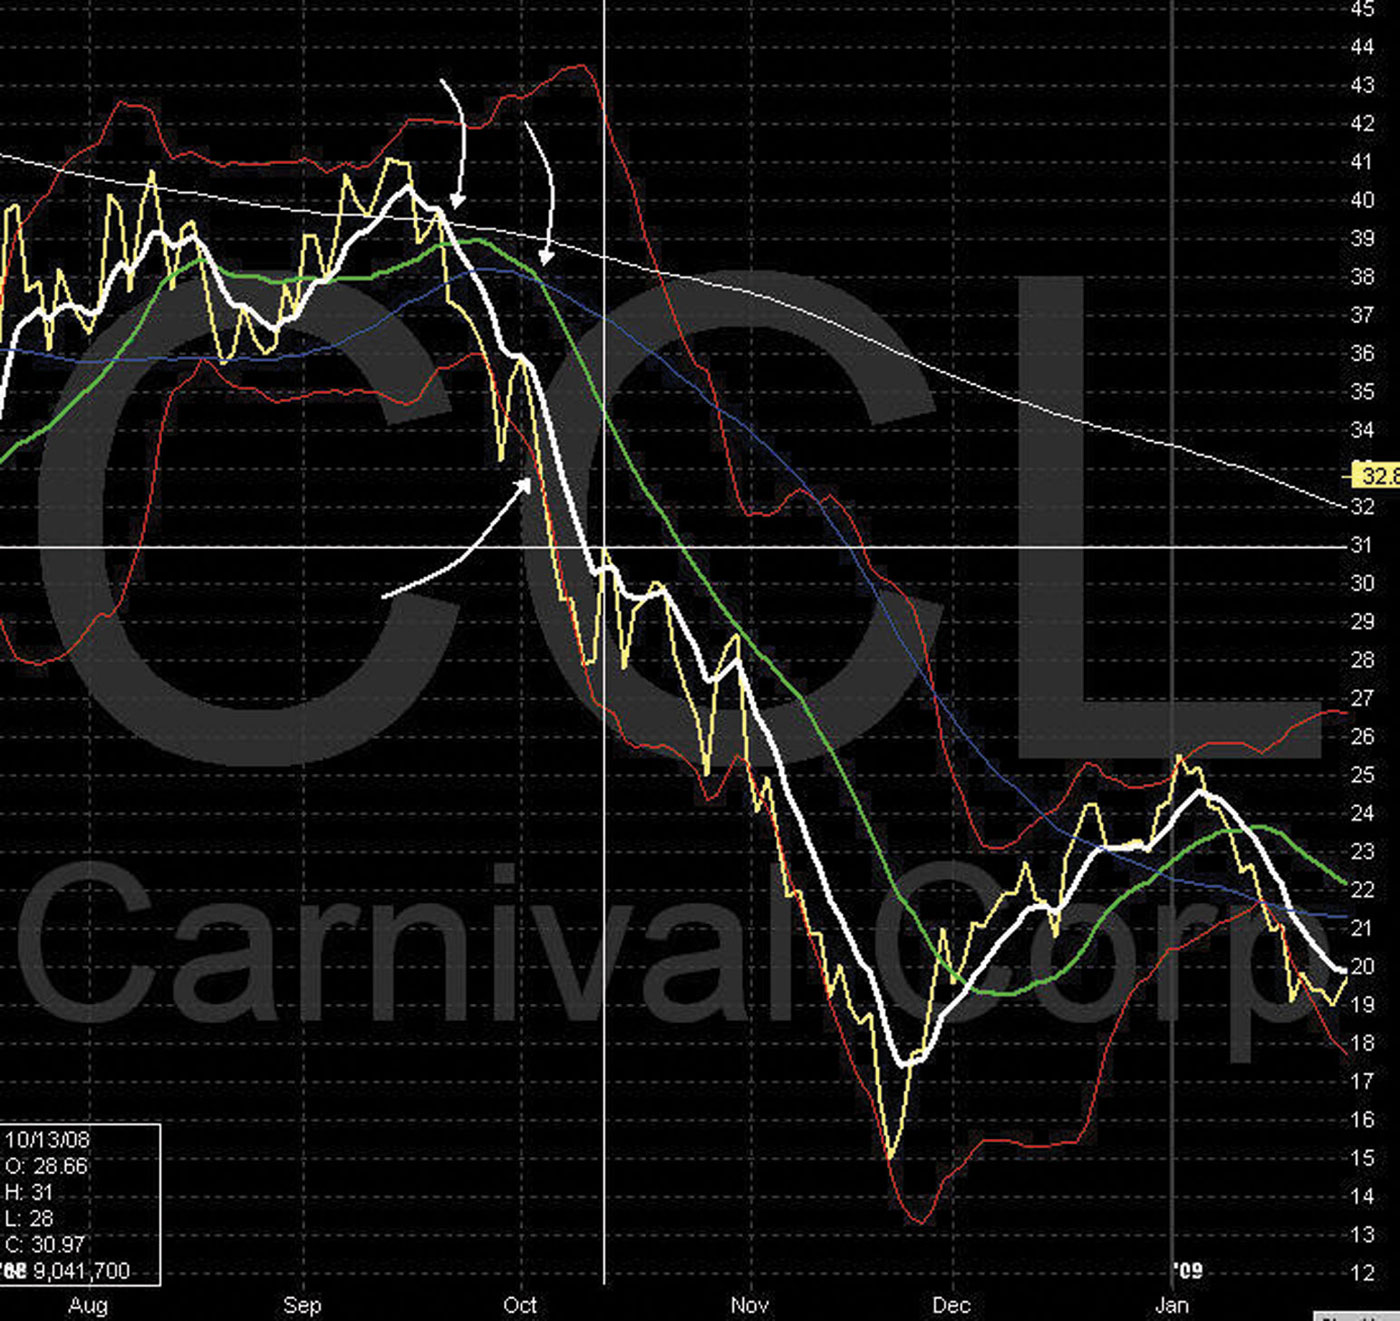
The reverse applies when we are managing a tethered slingshot (TSS)1. In Figure 6.2, note that, in mid-September, M1 flattens out and turns down toward M2. M1 continues on and crosses M2. M2 turns and follows M1, and continues on to cross M3. CCL is now stacked down with strong downward momentum. M3 turns and follows M2, confirming and validating this downward cycle, and indicates an excellent TSS.
FIGURE 6.2 Chart of CCL—MAs and BBs Stacked Down
In mid-March, the chart in Figure 6.3 shows a green PSAR arrow followed by a series of yellow dots moving up and spacing out. When the green arrow appears, we know that a crossover of red to blue has occurred on one or more of the lower indicator. ...
Read now
Unlock full access


