Ensure that Kibana is running before we perform the following step-by-step instructions. We are going to draw the Bollinger Band on the Kibana Visualize page:
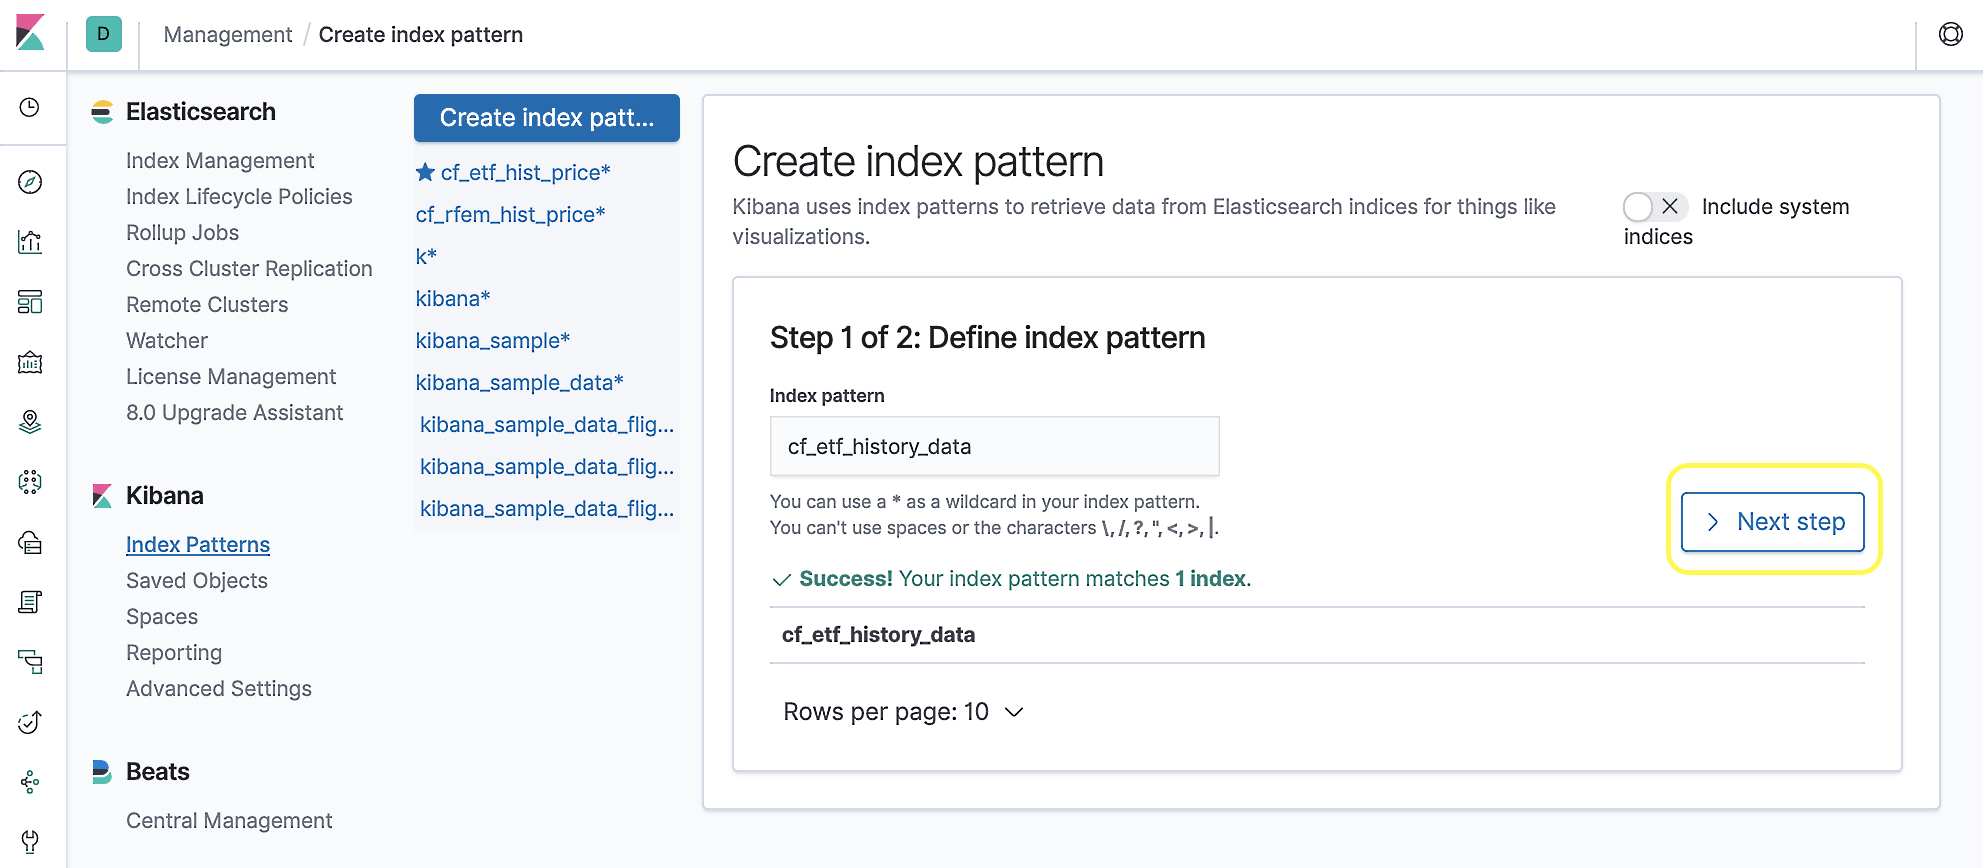
- Similar to the Creating index pattern subsection of Chapter 16, Machine Learning with Elasticsearch, let's create a Kibana index pattern named cf_etf_history_data, as shown in the following screenshot:

- Use a web browser and type http://localhost:5601/app/kibana#/visualize?_g=() to reach the Kibana Visualize page. We will see a panel that is similar to the following screenshot:
- Click the + button cover, which is by the ...

