Graphs of the Sine and Cosine Functions
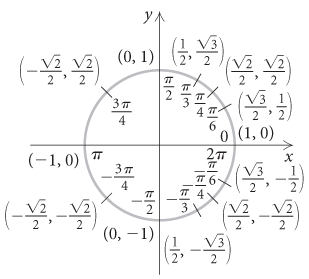
Properties of functions can be observed from their graphs. We begin by graphing the sine and the cosine functions. We make a table of values, plot the points, and then connect those points with a smooth curve. It is helpful to first draw a unit circle and label a few points with coordinates. We can either use the coordinates as the function values or find approximate sine and cosine values directly with a calculator.
| s | ||
|---|---|---|
| 0 | 0 | 1 |
| 0.5 | 0.8660 | |
| 0.7071 | 0.7071 | |
| 0.8660 | 0.5 | |
| 1 | 0 | |
| 0.7071 | ||
| 0 | ||
Get Algebra and Trigonometry, 5th Edition now with the O’Reilly learning platform.
O’Reilly members experience books, live events, courses curated by job role, and more from O’Reilly and nearly 200 top publishers.

