In this section, we shall display the metrics:
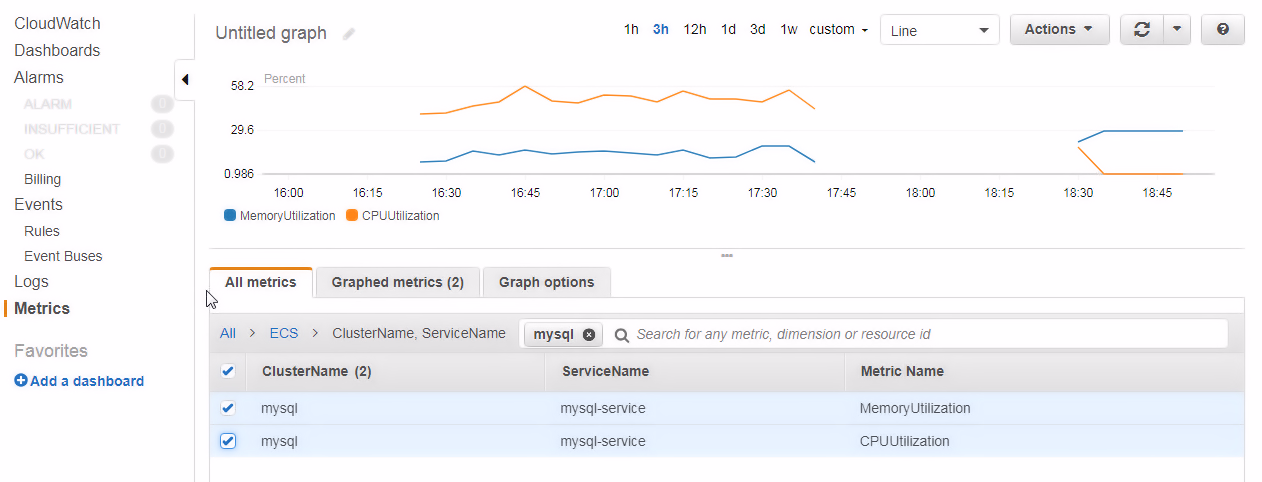
- Click on Metrics in the navigation, as shown in the following screenshot. Filter metrics for the mysql service with All | ECS ClusterName | ServiceNameSelect to display all metrics, which include MemoryUtilization and CPUUtilization metrics:
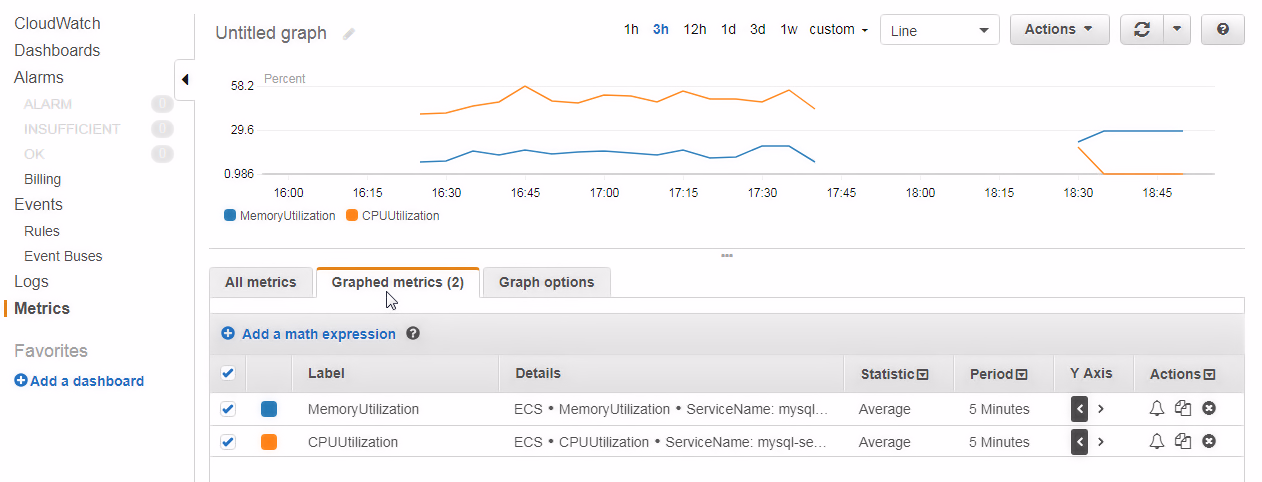
- Not all metrics may be graphed, although the MemoryUtilization and CPUUtilization metrics generated by a task are graphed. Select the Graphed metrics tab to display only the graphed metrics: