Chapter 6Streaming Insight
To achieve the state of streaming insight offered by Big Data, we have to have a basic understanding of statistics. Don't worry, I'm not going to spend time on the math. Rather, we'll look at those factors that help your data scientist pick the right tools, based on the decisions you need to make and the data you have on hand, so that you can stream insight to those who need it most. First, though, there are different forms of analytics used in different ways. The most common are those analytics that form the basis of the reports you get or give, but there are also discovery analytics and production analytics.
The Model Cycle
Illustrated in Figure 6.1 is the cycle of analytics, from reporting to discovery to production. Reporting analytics are those statistics used to compare aspects of the business, such as salespeople or marketing campaigns. Discovery is the application of statistics to your data to understand why something is happening, while production analytics are those models that select offers (like Target's offers to expectant mothers) or make other decisions automatically.
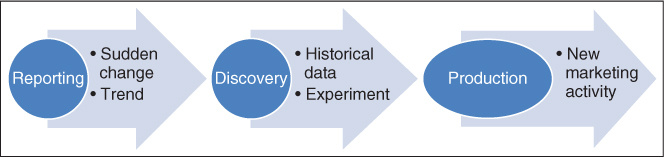
Figure 6.1 An Analytics-Based Process of Organizational Learning
When reporting causes recognition of a sudden change or trend, discovery analytics can then be applied to identify why. Once the answer is known, production analytics can become part of the automation process ...
Get Analytics and Dynamic Customer Strategy: Big Profits from Big Data now with the O’Reilly learning platform.
O’Reilly members experience books, live events, courses curated by job role, and more from O’Reilly and nearly 200 top publishers.

