Appendix CImplementation Flowcharts
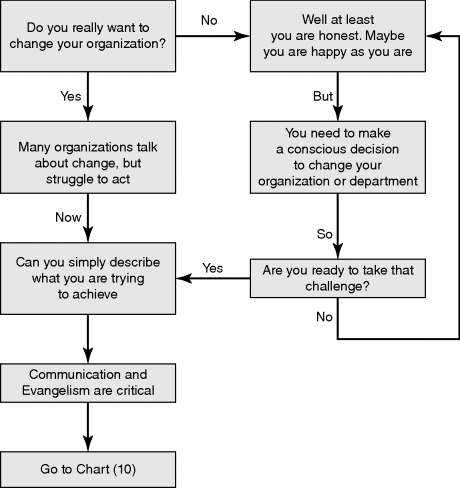
The flow diagram depicting the creation of the analytical insurer for changing the organization.

Figure C.1 Creating the Analytical Insurer
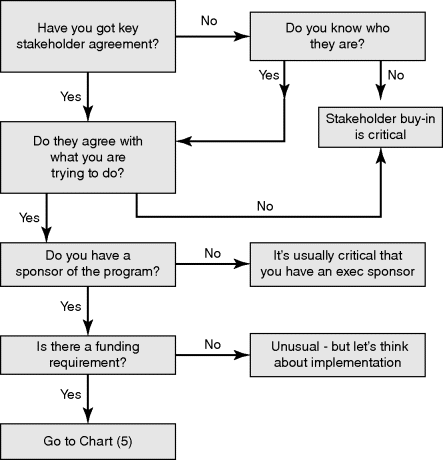
The flow diagram depicting management of key stakeholders.

Figure C.2 Management of Key Stakeholders
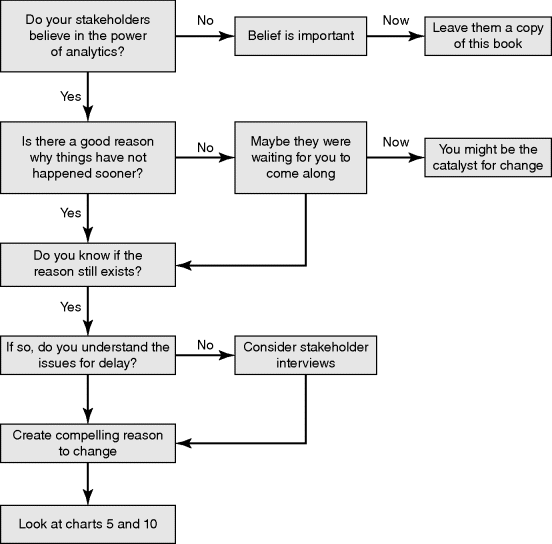
The flow diagram depicting believe of stakeholders in the power of analytics.

Figure C.3 Stakeholder Buy-In

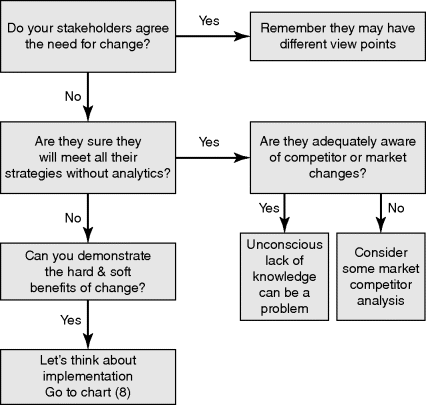
The flow diagram depicting the creation of a compelling reason for change.

Figure C.4 Creating a Compelling Reason for Change
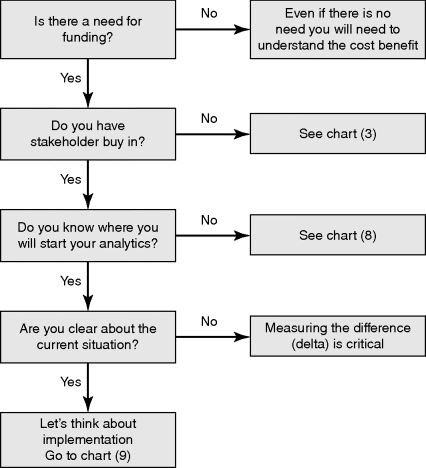
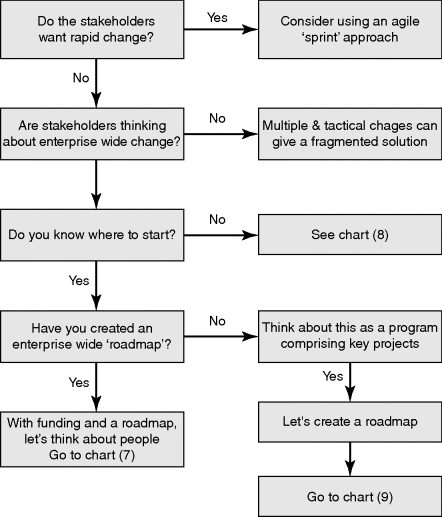
The flow diagram depicting a case of funding.

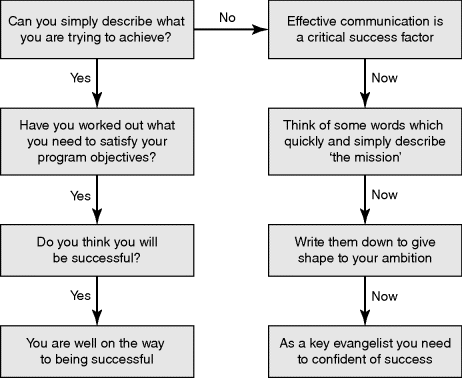
Figure C.5 Making a Case for Funding

The flow diagram depicting the implementation of analytical change.

Figure C.6 Implementing Analytical Change
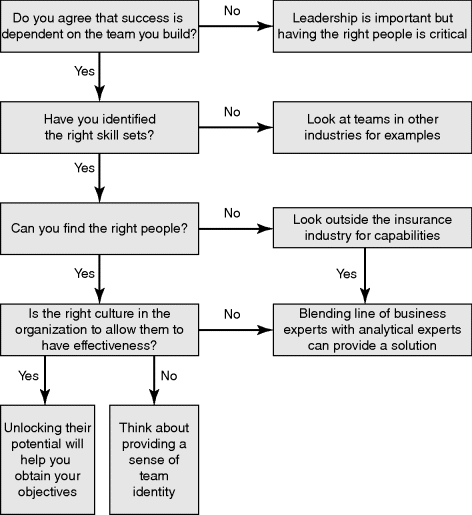
The flow diagram depicting the process of recruitment of the team.

Figure C.7 Recruiting the Team

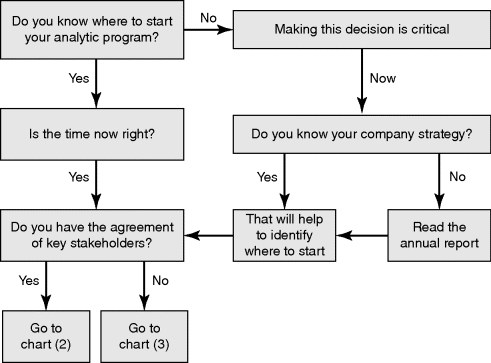
The flow diagram depicting the starting point of change.

Figure C.8 Starting Point of Change

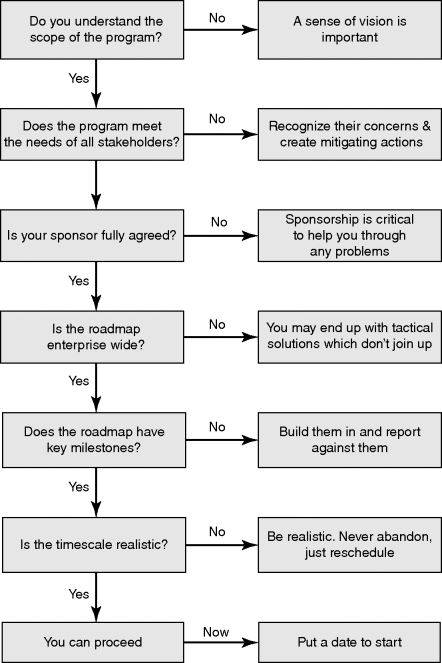
The flow diagram depicting the creation of roadmap for scope of the program.

Figure C.9 Creating a Roadmap

The flow diagram depicting the communications and evangelizing change.

Figure C.10 Communications and Evangelizing Change

Figure C.11 Effective Financial Performance ...

Get Analytics for Insurance now with the O’Reilly learning platform.

O’Reilly members experience books, live events, courses curated by job role, and more from O’Reilly and nearly 200 top publishers.