6Problems – Estimation of Variables and Model Parameters from Plant Data
P_6.1 6.1.1
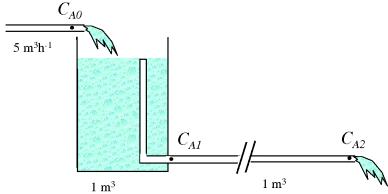
A solution is fed at 5 m3 h−1 through a stirred vessel of volume 1 m3, before it enters a long narrow pipeline which has a total volume of 1 m3.

- Using a 10 s time step, set up a model in MATLAB® which will allow you to simulate the behaviour of this system for a varying concentration CA0 of a species ‘A’ in the feed to the vessel. Your variations of CA0 should be random and uncorrelated, drawn on each time step from a uniform top-hat distribution in the range of 0–100 ppm.
- Using data generated over 2 h, determine and plot the cross-correlation and autocorrelation ...
Get Applied Process Control now with the O’Reilly learning platform.
O’Reilly members experience books, live events, courses curated by job role, and more from O’Reilly and nearly 200 top publishers.

