Chapter 20
Controlling Charts with Menus, Combo Boxes, and Buttons
The vision is really about empowering workers, giving them all the information about what’s going on so they can do a lot more than they’ve done in the past.
—Bill Gates
Founder of Microsoft
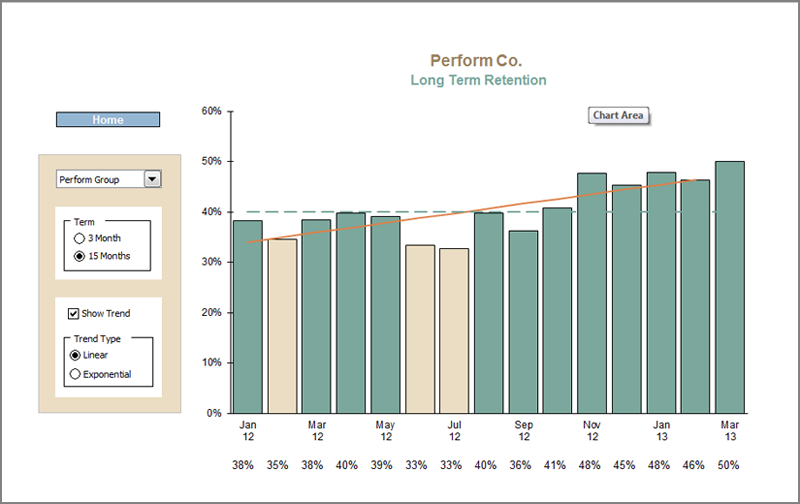
Microsoft Excel allows you to create a user interface for your scorecards and dashboards that looks and operates like any Windows application. You can add several kinds of controls to your scorecards and dashboards: lists, combo boxes (also called drop-down lists), scroll bars, and option buttons. As shown in Figure 20-1, with the addition of combo boxes, check boxes, and option buttons, you can make your dashboards more interactive and easier to use and prevent many errors. In Chapter 20 you will learn how to add these user controls to your dashboards. They will make your dashboards easier to use and reduce the mistakes users make.
Figure 20-1: By combining combo boxes, option buttons, and check boxes, you help your users easily interact with the scorecards and dashboards you create.
Chapter 18 describes how to select data from a database and manipulate it by using INDEX and MATCH. Now, by combining INDEX and MATCH with controls, you can create interactive charts, data selectors, scrolling charts, and more that any level of user can operate.
Adding Combo Boxes, Lists, Check Boxes, and More to Your Dashboards
As shown in Figure ...
Get Balanced Scorecards and Operational Dashboards with Microsoft Excel, 2nd Edition now with the O’Reilly learning platform.
O’Reilly members experience books, live events, courses curated by job role, and more from O’Reilly and nearly 200 top publishers.

