7.4 The Graph of the Quadratic Function
The Parabola • Vertex and y-intercept • Solving Quadratic Equations Graphically
In this section, we discuss the graph of the quadratic function and show the graphical solution of a quadratic equation. By letting we can graph this function, as in Chapter 3.
EXAMPLE 1 Graphing a quadratic function
Graph the function
First, let Then set up a table of values and graph the function as shown in Fig. 7.11. We can also display it on a calculator as shown in Fig. 7.12.
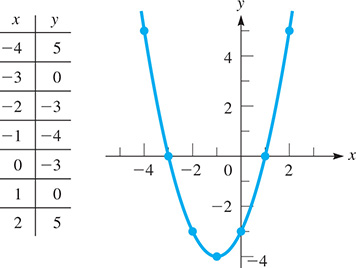
Fig. 7.11
Fig. 7.12
The shape of the graph in Figs. 7.11 and ...
Get Basic Technical Mathematics, 11th Edition now with the O’Reilly learning platform.
O’Reilly members experience books, live events, courses curated by job role, and more from O’Reilly and nearly 200 top publishers.

