Linear models lead to posterior distribution where  and
and  are highly correlated. See the following code and Figure 3.4 for an example:
az.plot_pair(trace_g, var_names=['α', 'β'], plot_kwargs={'alpha': 0.1})
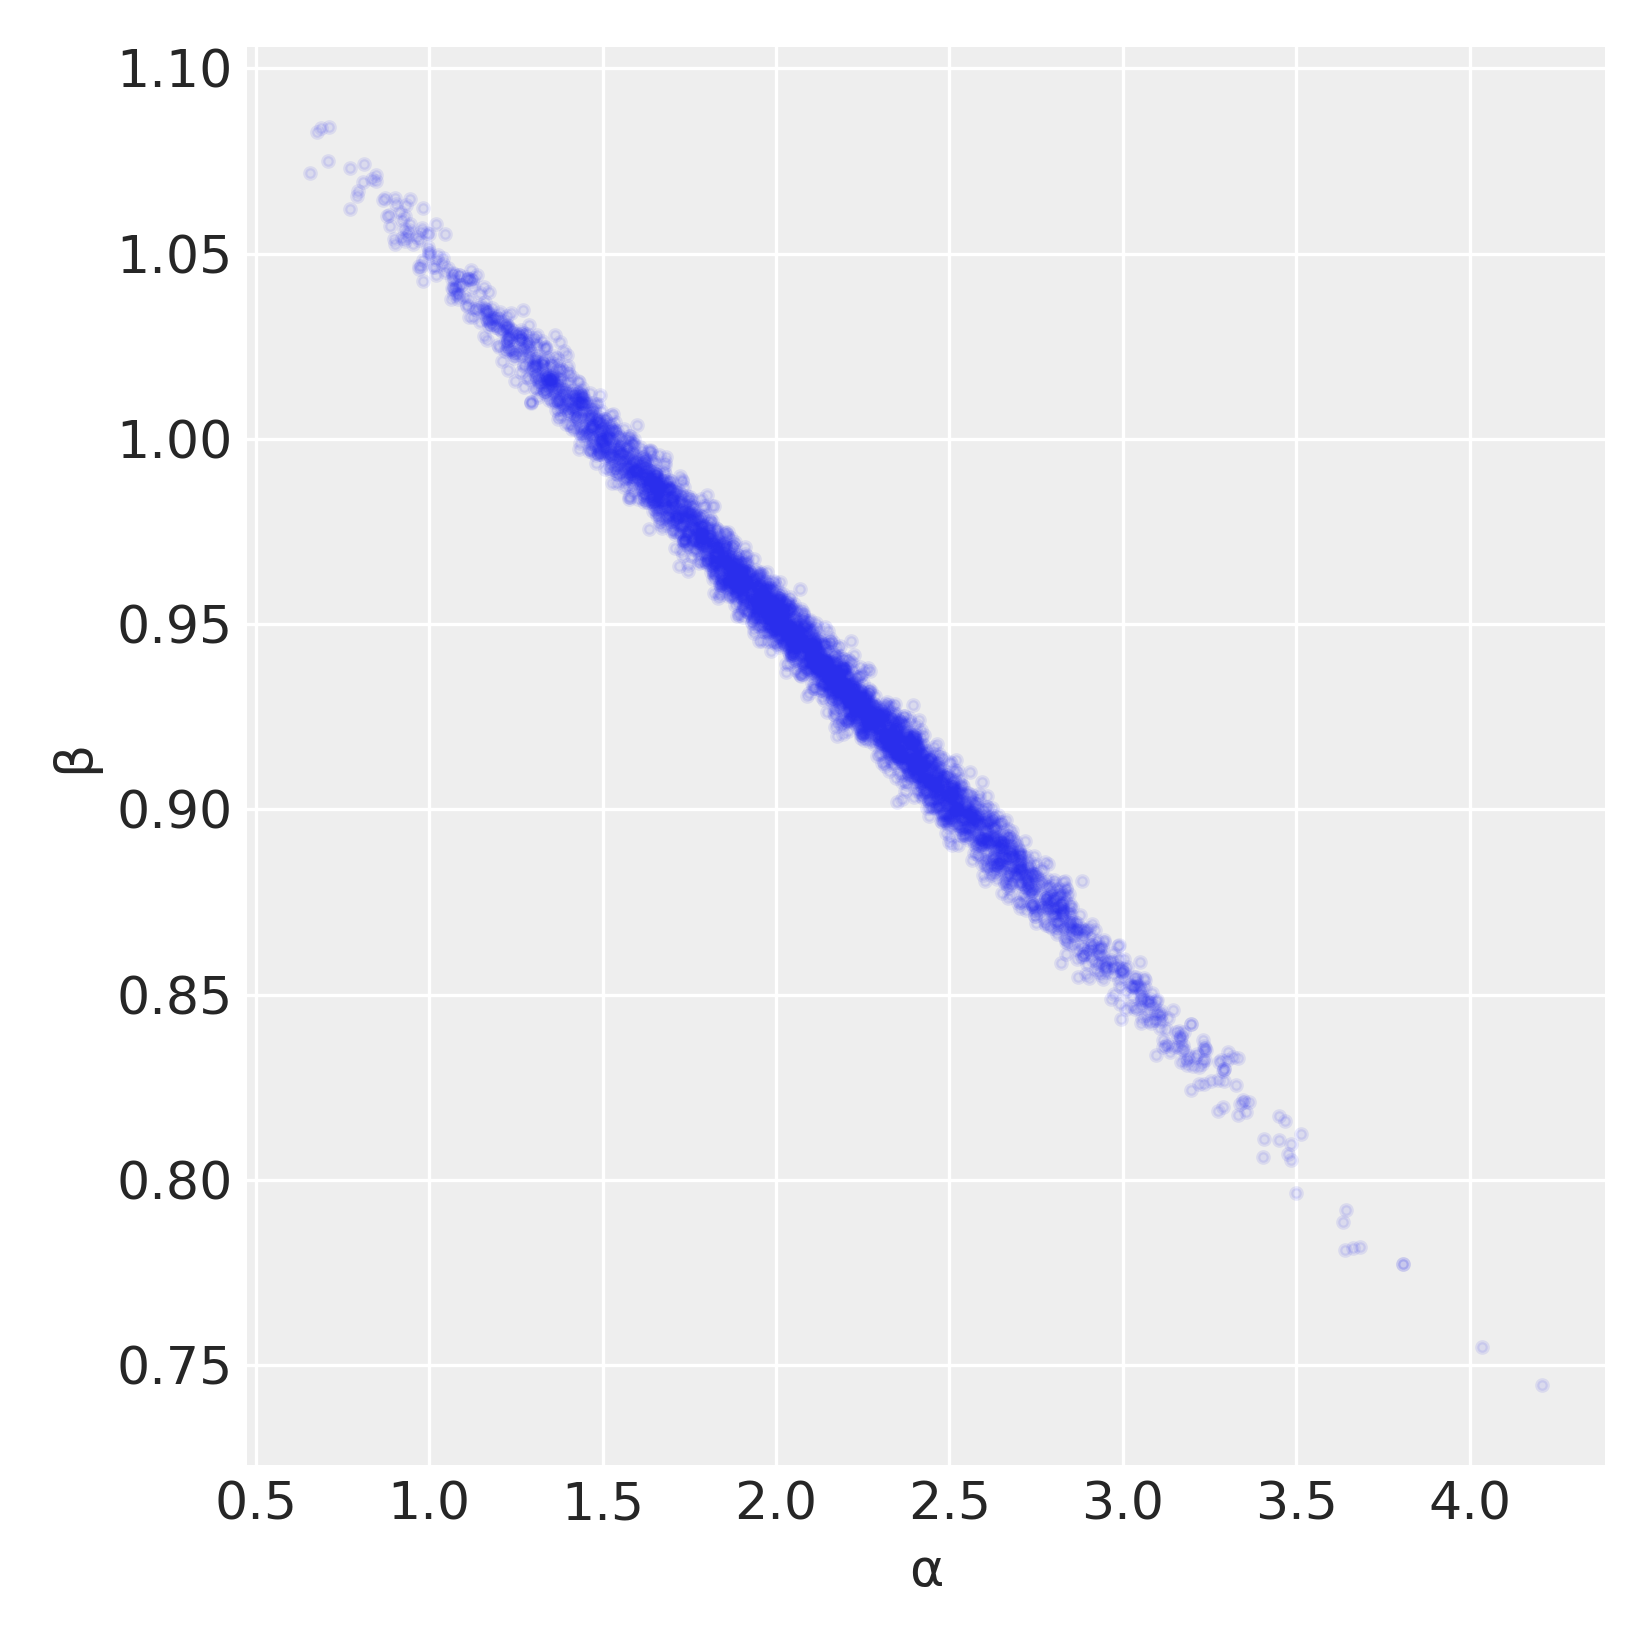
Figure 3.4
The correlation we are seeing in Figure 3.4 is a direct consequence of our assumptions. No matter which line we fit to our data, all of them should pass for one point, that is, the mean of the ...

