Beauty in Discovery
We consider spatially ordered and spatial treemaps of large hierarchical data sets that have high data/location ratios to be aesthetically pleasing, and offer the figures presented in this chapter as candidate beautiful depictions of beautiful data. But things of beauty should be lucid, usable, and ultimately satisfying as well as elegant. Matsumoto (2007) expresses this in the context of computer code through his belief that beautiful code is readable. Just as maps make complex geospatial data readable in a fit-for-purpose manner that enables multiple spatial relationships to be determined and tasks such as navigation, geographic comparison, and pattern detection to be achieved, so our efforts aim to make analytical sense of the geography of the language of Geograph through readable graphics. Can we read Geograph? We contend that these and other graphics mean that we're well on our way toward interpreting some of the complexity of this rich and beautiful example of the kinds of geospatial data sets that are emerging, and using the kinds of relationships between description and location identified through our analysis to act upon this knowledge.
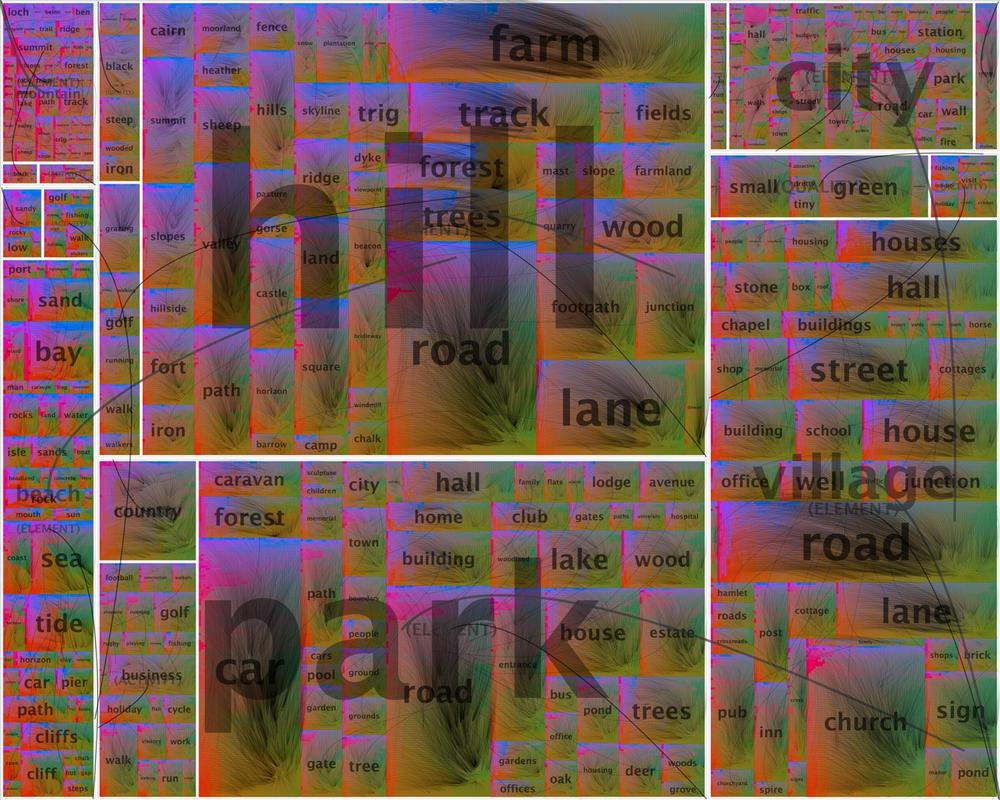
Figure 6-9. Spatial treemap of terms occurring in geograph titles and comments for six selected scene types. Displacement vectors show absolute locations of leaf nodes (co-occurring terms) and provide information about spatial ...
Get Beautiful Data now with the O’Reilly learning platform.
O’Reilly members experience books, live events, courses curated by job role, and more from O’Reilly and nearly 200 top publishers.

