Conclusion
We have looked at the data from multiple angles, and we have seen the same thing: the housing crisis has been relatively more damaging in poorer areas. The boom and the bust hit lower-priced homes both earlier and harder; cities with lower average incomes peaked higher and dropped lower. A great deal of the boom was associated with new construction, most of which was aimed at the lower end of the market.
Many of these new residences were built farther from San Francisco, in less developed areas where residents had lower average incomes, more children, and longer commutes. Although the biggest absolute decline in prices occurred at the high end, it was the less expensive houses that lost a greater proportion of their value.
All of this is consistent with what we have learned about subprime mortgages since the housing bust hit the headlines. Many people with poor credit were granted mortgages with initially low monthly payments. When those payments grew, they were unable to meet them, and the rates of mortgage defaults and foreclosures began to rise. We speculated earlier that the increase in sales in 2008 may be associated with foreclosures, and an interesting next step would be to locate data on foreclosures and align it with our sales data.

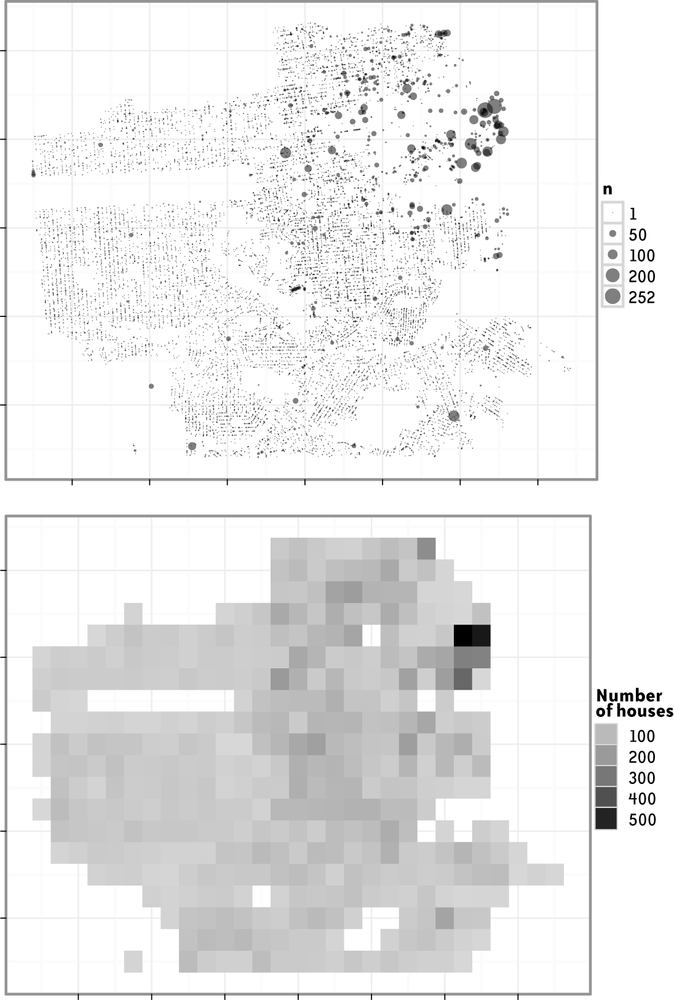
Figure 18-14. The geographic distribution of numbers of residential sales. (Top) This plot is similar to the previous plot, but the size ...
Get Beautiful Data now with the O’Reilly learning platform.
O’Reilly members experience books, live events, courses curated by job role, and more from O’Reilly and nearly 200 top publishers.

