5.6. Charts
Up until now, you have been looking at reports, which present detailed information along with some aggregate summary data. Sometimes your users will want a higher-level view of their data, which can provide some telling information across a greater number of rows. For this type of examination, charts are an excellent choice.
You have no doubt noticed that one of the choices in the Page Wizard is a chart and that there is a Chart choice in the Actions menu of an interactive report. When you create a chart on a page, you have a very broad range of customization options, which you will explore in the next chapter. But for the purposes of this quick fly-by of the main APEX functionality, you can just as easily create charts based on your interactive report.
Select Chart from the Actions menu, which will bring up the section shown in Figure 5-41.
Figure 5-41. Figure 5-41
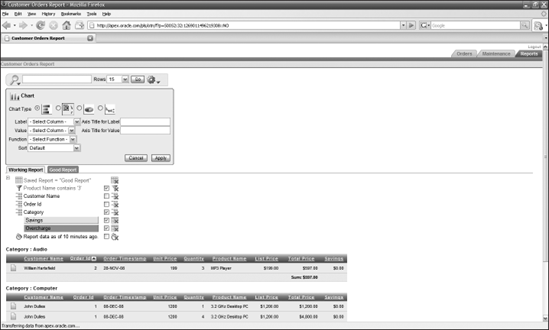
Select the pie chart option, the third from the left.
Once you select the pie chart, the fields for the axis labels disappear. All you have to do is to designate a column to supply the value used for the chart, a function to aggregate the values, and a sort order, if relevant.
Select the Product_Name column as the Label, the Total Price column as the Value, and Sum as the Function.
Click Apply to bring up the chart, as shown in Figure 5-42.
Your chart doesn't look too bad, especially considering how easy ...
Get Beginning Oracle® Application Express now with the O’Reilly learning platform.
O’Reilly members experience books, live events, courses curated by job role, and more from O’Reilly and nearly 200 top publishers.

