6.2. Interaction between Regions
The previous section illustrated how you can get two pages to work together to give users a more complete exploration of their data. In this section, you will see how you can implement a similar approach by using a select list to impose a filter condition on a Flash chart.
You are going to give your users another version of the chart you created in the previous section, which will show the breakdown of purchases, by category, for individual customers. The users will be able to select a customer from a dynamic selection list, so additional customers will instantly be available for this type of analysis.
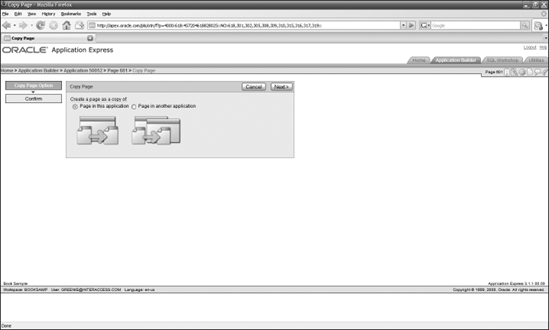
Try It Out: Copying a PageSince this chart will have a selection condition imposed on its data, you should start by copying your previous chart.
|
Get Beginning Oracle® Application Express now with the O’Reilly learning platform.
O’Reilly members experience books, live events, courses curated by job role, and more from O’Reilly and nearly 200 top publishers.

