Chapter 20. Presenting Data in a Cross Tab
A cross tab displays data in a row-and-column matrix that looks similar to a spreadsheet. Like a spreadsheet, the cross tab is ideal for summarizing data in a compact and concise format. It displays summary, or aggregate, values such as sums, counts, or averages. The cross tab groups these values by one set of data listed down the left side of the matrix and another set of data listed across the top of the matrix.
Figure 20-1 shows a cross tab that displays sales totals by state and by product line. The cross tab uses data from three fields: state, productline, and extendedprice.
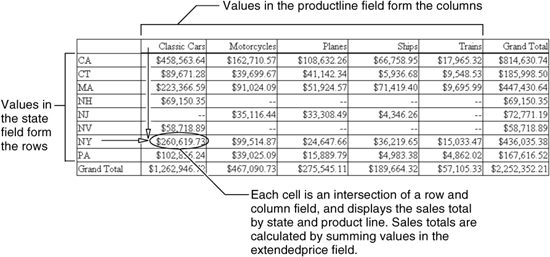
Figure 20-1 Cross tab ...
Get BIRT: A Field Guide to Reporting now with the O’Reilly learning platform.
O’Reilly members experience books, live events, courses curated by job role, and more from O’Reilly and nearly 200 top publishers.

