Integrated Debugger
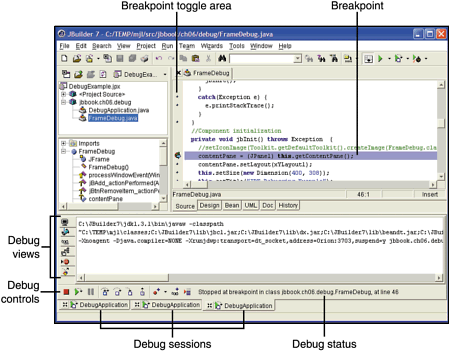
JBuilder’s IDE provides a rich interface for controlling all sorts of debugging information. When running under the debug Virtual Machine (VM), the IDE displays debug controls, debug views, debug status, and a debug session.
Figure 6.1 shows the major features of the JBuilder IDE while in Debug mode. To enter Debug mode, click on Run, Debug Project from the menu.
Figure 6.1. The JBuilder IDE in Debug mode.

Debug Controls
JBuilder provides many ways to continue execution of your application after it is paused. All the continuation commands are available from the Run menu. A subset of the available continuation commands ...
Get Borland® JBuilder™ Developer’s Guide now with the O’Reilly learning platform.
O’Reilly members experience books, live events, courses curated by job role, and more from O’Reilly and nearly 200 top publishers.

