CHAPTER 12
Square of 9
This chapter will serve as an introduction to the Gann square of 9. There are many applications and I could go much deeper if this were a book on Gann. But the goal here is to demystify some of Gann’s most interesting work, cut down substantially on your learning curve, and give you an edge in identifying important market turns.
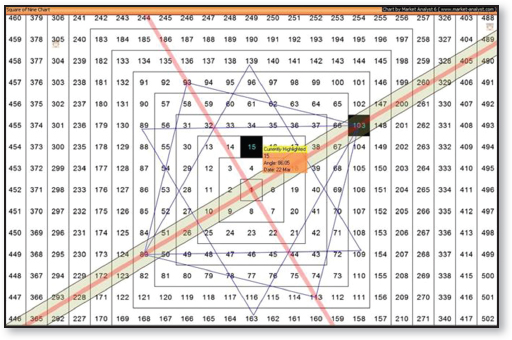
The best way to think about Gann’s matrix for the square of 9 is to think of it as if you were looking at the top of a pyramid. Each revolution around that pyramid is the equivalent of a 360-degree circle. Figure 12.1 is the matrix.
FIGURE 12.1 Gann Square of 9

This matrix comes to us courtesy of Market-Analyst software, which has specialized in Gann software for years. Look at the numeral 1 in the center. Figure 12.2 gives you a much bigger overview. Think of this as the top of the pyramid. Just imagine you are in a plane right over the Great Pyramid. You are basically looking at a three-dimensional object in only two dimensions. What Gann did was apply that very same philosophy to our two-dimensional price charts. You’ve heard from Fibonacci and Elliott people that markets are spiraling in all degrees of trend all the time, right? They don’t exactly tell you how they are spiraling or what you need to do to make that information practical. What Gann did was convert the movement from price A to price B to degrees in a circle. Why ...
Get Breakthrough Strategies for Predicting Any Market: Charting Elliott Wave, Lucas, Fibonacci, Gann, and Time for Profit, 2nd Edition now with the O’Reilly learning platform.
O’Reilly members experience books, live events, courses curated by job role, and more from O’Reilly and nearly 200 top publishers.

