All these commands are also available from the Debug toolbar, which is shown
in Figure 5.52.
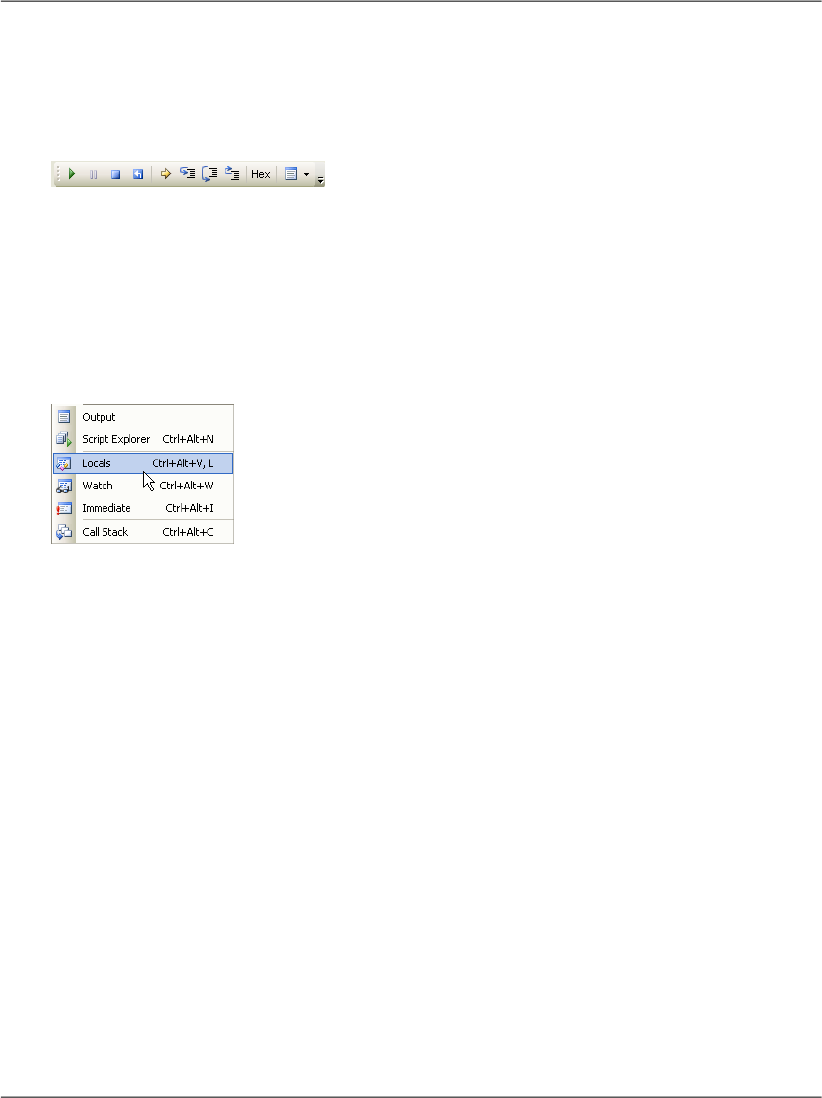
Figure 5.52. The Debug toolbar
This toolbar appears by default when you’re debugging, but if it doesn’t, you can
make it display by right-clicking the toolbar and selecting Debug. The Debug
toolbar reflects the commands you can find in the Debug menu, which is depicted
in Figure 5.53, and the button on the extreme right gives you easy access to the
various debugging windows.
Figure 5.53. Debugging windows accessible from the toolbar
Other Kinds of Errors
Along with the runtime errors we’ve seen so far, ASP.NET can also throw the
following kinds of errors:
configuration errors
These are caused by problems in the Web.config
file. Try adding an incorrect tag to Web.config, and
the next time you try to load the application, an
error will occur.
parser errors
Parser errors are caused by the use of incorrect syn-
tax in an ASP.NET script page; for instance, prob-
lems in the definitions of ASP.NET controls in-
cluded in a web form will cause parser errors.
compilation errors
These errors are raised by the compiler when there’s
a syntax error in the page’s C# or VB code, and will
be caught by Visual Web Developer.
210
Chapter 5: Building Web Applications
If you try to execute a page that contains compilation errors with Visual Web
Developer, those errors will be signaled right away, and the page won’t be loaded
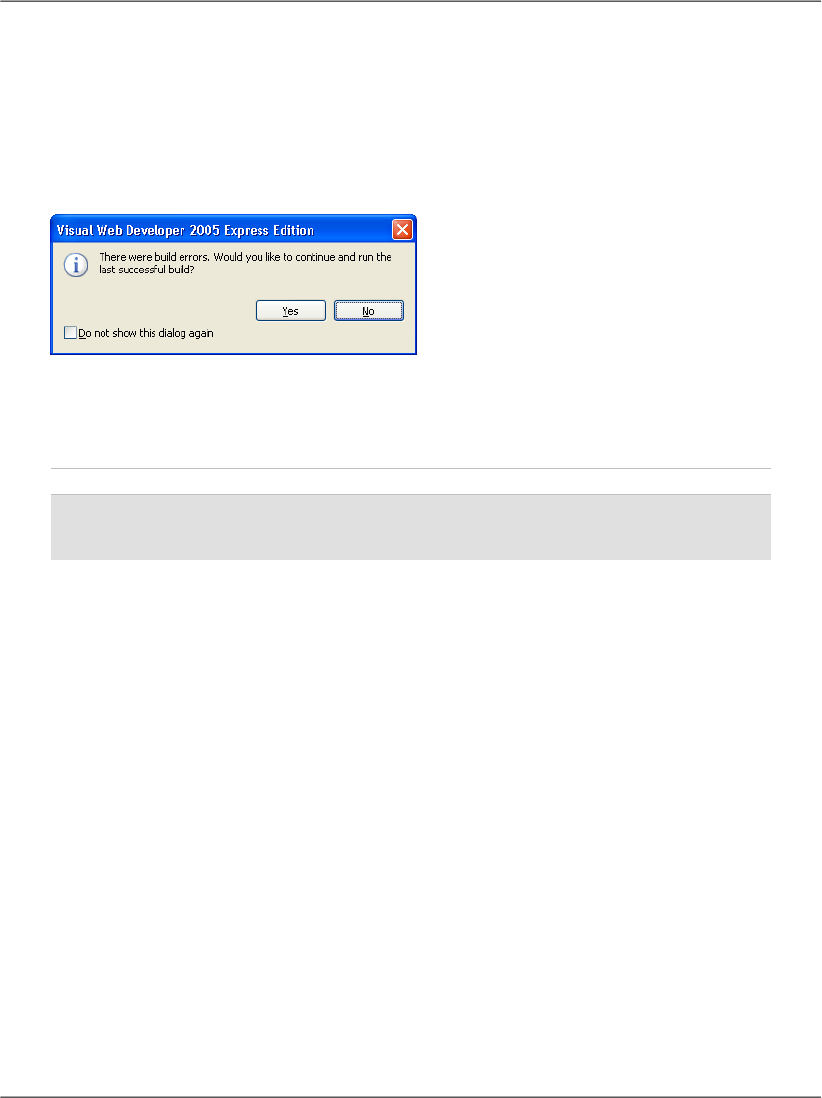
in the web browser (see Figure 5.54).
Figure 5.54. Visual Web Developer warns about a compilation
error
If you’d like to try this for yourself, write some VB code, but terminate one of
the lines with a semicolon as if you were writing C# code, as shown in the snippet
below.
Visual Basic
Sub Page_Load(s As Object, e As EventArgs)
timeLabel.Text = DateTime.Now.ToString();
End Sub
If you try to run this code, Visual Web Developer will present you with the
message shown in Figure 5.54. If you choose Yes, a previous version of the code
that used to compile successfully will be executed. Usually, this isn’t what you
want: you’ll prefer to investigate the problem and fix the error. If you choose No,
Visual Web Developer will display a window called Error List. Double-click the
entry in the Error List, and the offending portion of code will be highlighted in
the editor. Moreover, hovering your cursor over the highlighted code will display
a tooltip containing a few details about the error, as Figure 5.55 illustrates.
After such a demonstration, I hope you agree that Visual Web Developer is a
fantastic tool. What you’ve just seen is merely a common-sense feature in the
world of Visual Web Developer, though—much more exciting and powerful fea-
tures are available!
211
Other Kinds of Errors
Get Build Your Own ASP.NET 2.0 Web Site Using C# & VB, Second Edition now with the O’Reilly learning platform.
O’Reilly members experience books, live events, courses curated by job role, and more from O’Reilly and nearly 200 top publishers.

