Chapter 4. Tracing Chaos Experiments
“Nothing clears up a case so much as stating it to another person.”
Sherlock Holmes, from “Silver Blaze” by Sir Arthur Conan Doyle
Distributed tracing is critical to comprehending how an interaction with a running system propagates across the system. By enriching your logging messages with trace information, you can piece together the crucial answers to questions such as what happened, in what order, and who instigated the whole thing. When it comes to understanding how chaos experiments affect a whole system, add your chaos experiments to the tracing observability picture.
In this chapter you’re going to see how you can use the raw observability signals from the Chaos Toolkit (Chapter 2) to enable a new type of Control that will be able to push trace information into distributed tracing dashboards so that you can view your chaos experiment traces alongside your regular system interaction traces.
Open Tracing
Open Tracing is a helpful open standard for adding and communicating distributed tracing about a system.
The Chaos Toolkit comes with an Open Tracing extension that provides an Open Tracing Control, and it’s this control that you are going to use and see in action in this chapter.
The Open Tracing Control
After you have installed the Open Tracing Chaos Toolkit extension, your experiments can be configured to use the open tracing control by specifying a configuration block:
{"configuration":{"tracing_provider":"jaeger","tracing_host":"127.0.0.1","tracing_port":6831},"controls":[{"name":"opentracing","provider":{"type":"python","module":"chaostracing.control"}}]}
This configuration turns on the control and points the open tracing feed at a destination. The destination in this case is a Jaeger tracing visualisation dashboard, but it can be to any tool that supports receiving an open tracing feed.
The preceding configuration tells the Chaos Toolkit to send an experiment execution’s traces to the Jaeger dashboard where those traces can be displayed alongside all the other traces in your runtime system, as shown in Figure 4-1.
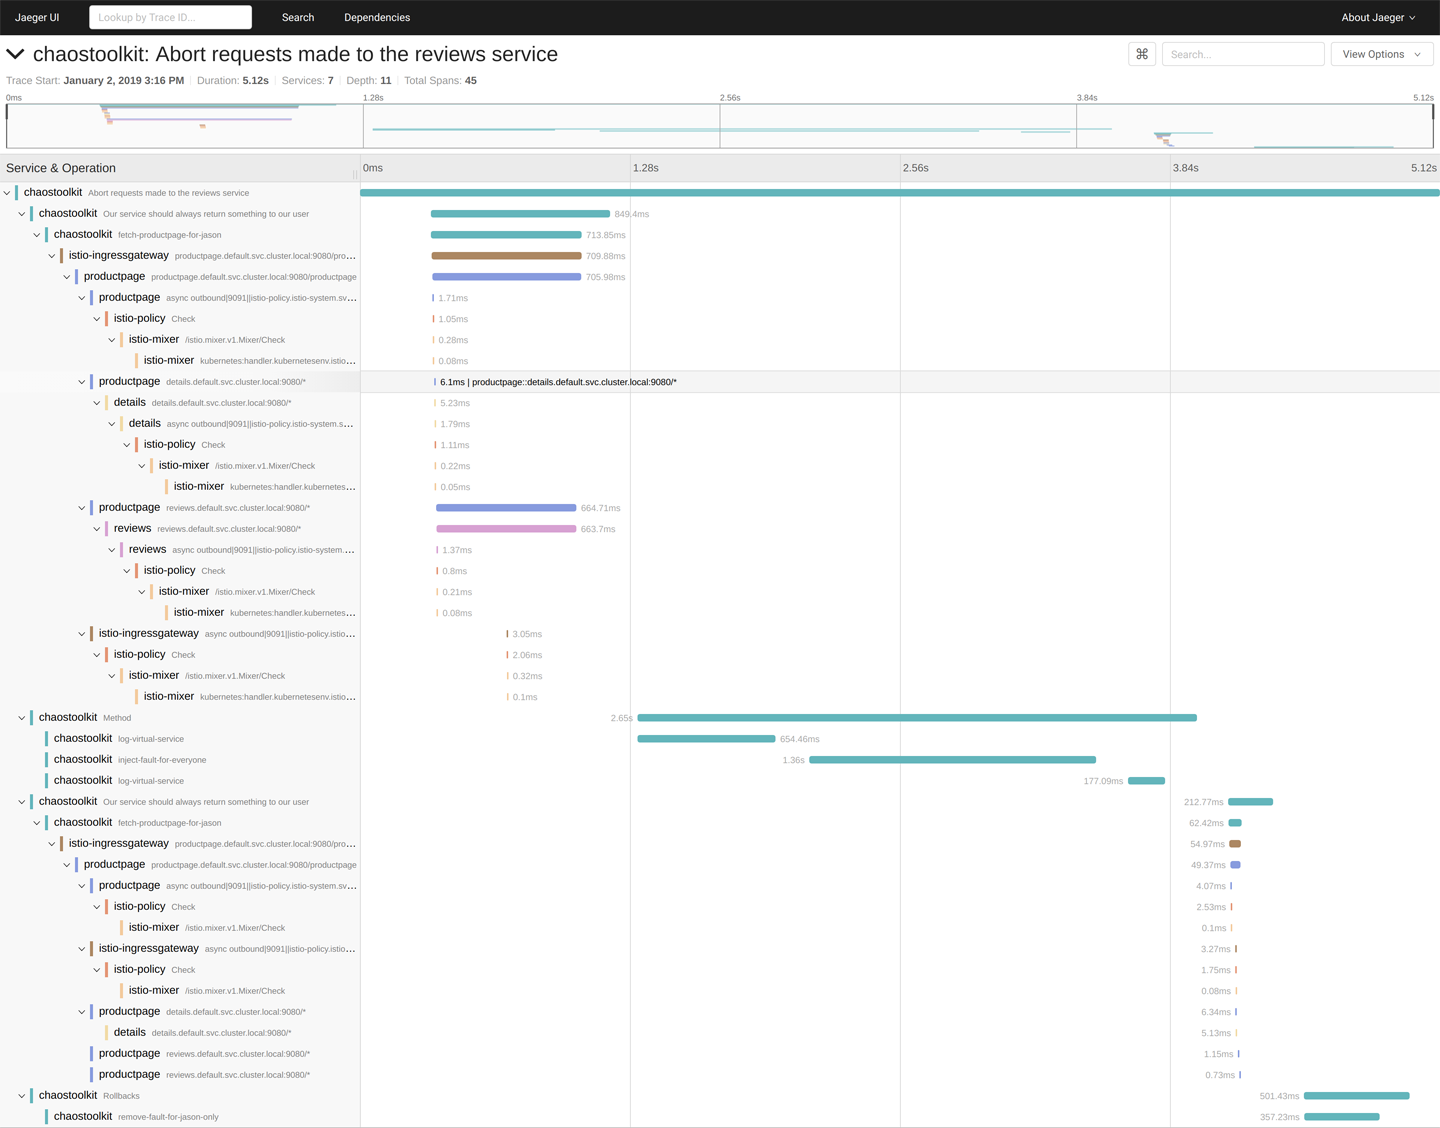
Figure 4-1. Application and chaos traces in the Jaeger dashboard
Summary
Chaos experiment traces give you a way of correlating your chaos experiment execution to the potential effects and traces occuring elsewhere in your systems. You can observe when your chaos was executing and even begin to dive into observable impacts on other system traces at the same time.
The combination of incorporating chaos experiments into your centralized logging and then adding their execution traces to your distributed tracing picture are two foundation steps to making chaos engineering observable. In the next chapter we’ll conclude by looking at how this foundation can be extended into new observability areas and systems to fit your specific needs.
Get Chaos Engineering Observability now with the O’Reilly learning platform.
O’Reilly members experience books, live events, courses curated by job role, and more from O’Reilly and nearly 200 top publishers.

