Visualizing the data
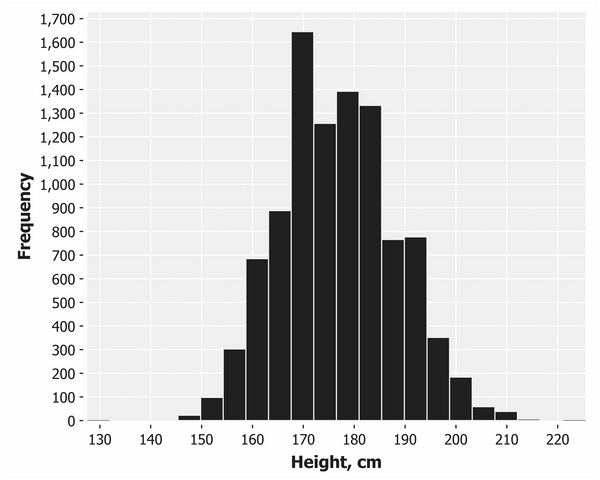
First, we'll consider the spread of the heights of the London 2012 athletes. Let's plot our height values as a histogram to see how the data is distributed, remembering to filter the nil values first:
(defn ex-3-2 []
  (-> (remove nil? (i/$ "Height, cm" (athlete-data)))
      (c/histogram :nbins 20
                   :x-label "Height, cm"
                   :y-label "Frequency")
      (i/view)))
This code generates the following histogram:

The data is approximately normally distributed, as we have come to expect. The mean height of our athletes is around 177 cm. Let's take a look at the distribution of weights of swimmers from the 2012 Olympics:
(defn ex-3-3 [] (-> (remove nil? (i/$ ...
Get Clojure for Data Science now with the O’Reilly learning platform.
O’Reilly members experience books, live events, courses curated by job role, and more from O’Reilly and nearly 200 top publishers.

