Chapter 3. The Rise of Open Source Metrics
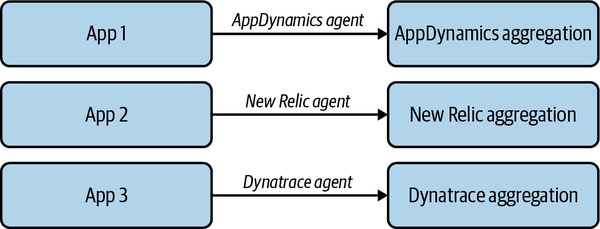
Before the industry standardized on Prometheus, many companies were forced to use proprietary metrics solutions, such as AppDynamics, Dynatrace, or New Relic. These vendors control the instrumentation and aggregation of metrics using agents, which are software processes that run alongside an application to collect data and then send it to an external server. If you are running an AppDynamics observability setup, you have no choice but to use the AppDynamics agent to send metrics to their system, as shown in Figure 3-1. This is called agent-based application instrumentation. Applications typically need to install a software library or software development kit to run these agents and send the data back to the aggregation server.
Agents are also largely noninteroperable. This means that if you rely on AppDynamics, the same agents cannot easily aggregate those same metrics into New Relic’s system.

Figure 3-1. Applications instrumented using agents
Agent-based systems use the same system resources as the application and in some cases can slow down or even crash applications. SRE teams can’t observe when agents cause performance issues since, after all, they are using the same agents to send the data back to the aggregation servers.
User-Controlled Metric Data Collection
To solve the performance issues, the SRE team at ecommerce site Etsy ...
Become an O’Reilly member and get unlimited access to this title plus top books and audiobooks from O’Reilly and nearly 200 top publishers, thousands of courses curated by job role, 150+ live events each month,
and much more.
Read now
Unlock full access