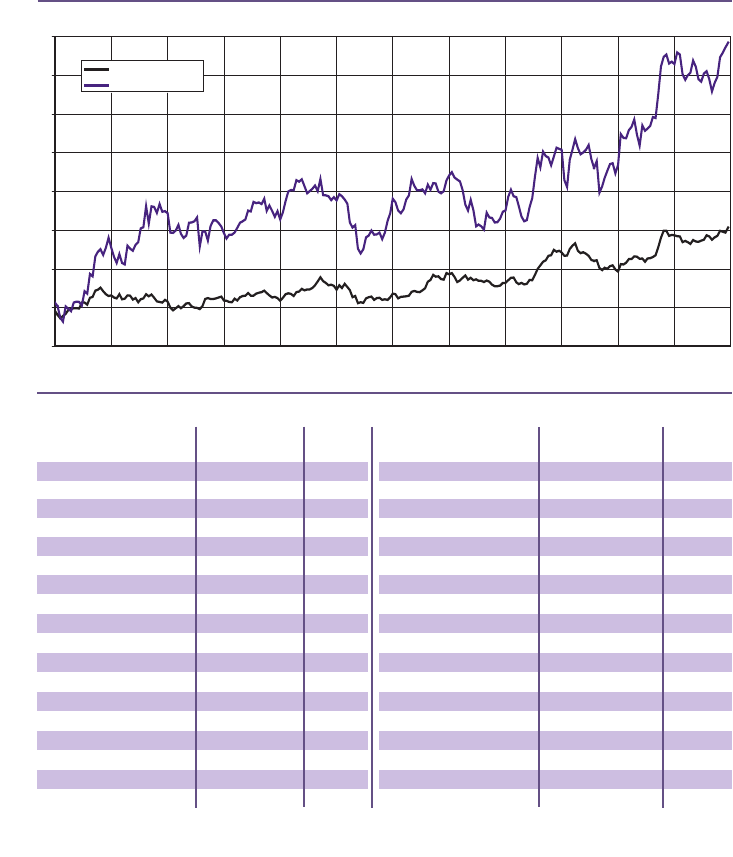
155
SILVER ONE-YEAR SEASONAL PATTERN
SILVER CYCLE, SEASONAL PATTERN, AND TRADING GUIDE
Silver has a tendency to make a major seasonal bottom in September, and then
has a tendency to post major seasonal peaks in April. It tracks the price moves
of gold, but from a traders or investors perspective, it is considered the poor
man’s gold. Due to technology and the age of digital imaging, silver has lost
a major portion of its industrial demand element because there is no longer a
tremendous demand from the photo industry. It is still needed, however, for film
and x-ray processing.
Silver prices are also subject to spikes in demand from the investment com munity,
which uses silver as a hedge or protection from concerns over inflation or times of
economic instability and uncertainties. Dollar weakness helps support silver’s
value. Longer-term cyclical forces can dramatically impact the seasonal price
moves of this market, like we saw in the June–August time period in 2007, just
ahead of the credit bubble bursting and the onset of recession in December 2007.
–5
0
5
10
15
20
25
30
Jan Feb Mar Apr May Jun Jul Aug Sep Oct Nov Dec
25-Year Pattern
5-Year Pattern
Based on near-term futures contract daily data 1985–2009
SILVER NEAR-TERM CONTRACT ANNUAL HIGHS, LOWS, AND CLOSES SINCE 1973
HIGH LOW YEAR HIGH LOW YEAR
YEAR DATE CLOSE DATE CLOSE CLOSE YEAR DATE CLOSE DATE CLOSE CLOSE
1973 12/31 329.7 01/22 196.1 329.7 1992 01/16 433.8 11/10 364.5 369.0
1974 02/26 624.2 01/04 329.0 447.0 1993 08/02 545.8 02/22 355.0 511.7
1975 08/07 528.5 01/21 398.5 423.6 1994 03/25 580.0 12/05 464.5 491.7
1976 07/06 518.8 01/26 385.3 439.0 1995 05/04 616.0 03/03 442.0 520.7
1977 03/21 500.8 08/15 432.6 484.9 1996 02/02 584.0 11/06 471.3 479.0
1978 10/30 636.5 02/08 484.8 613.7 1997 12/24 637.8 07/16 418.5 598.8
1979 12/31 2905.0 01/11 598.5 2905.0 1998 02/05 728.0 08/31 467.8 502.0
1980 01/21 4150.0 05/21 1140.0 1612.0 1999 09/28 577.0 04/14 486.0 545.3
1981 01/05 1670.0 11/19 816.0 829.0 2000 02/04 557.2 11/21 463.0 463.5
1982 12/29 1138.0 06/21 499.0 1110.0 2001 01/18 482.5 11/21 403.5 458.8
1983 02/16 1475.0 11/18 855.0 915.5 2002 06/04 512.5 01/31 422.3 481.2
1984 03/05 1021.0 12/31 638.0 638.0 2003 12/30 599.3 03/21 435.3 596.5
1985 04/08 673.5 03/11 558.5 590.5 2004 04/06 822.0 05/11 552.3 683.7
1986 01/24 633.5 05/19 489.5 546.0 2005 12/09 909.5 01/07 644.8 889.0
1987 05/15 950.0 02/17 540.5 677.0 2006 05/11 1493.5 01/05 887.2 1293.5
1988 07/20 790.0 11/21 602.5 613.0 2007 11/09 1554.5 08/16 1149.5 1492.0
1989 01/23 625.5 10/10 510.0 527.3 2008 03/05 2078.5 10/28 879.0 1129.5
1990 01/12 538.8 12/14 400.5 424.7 2009 12/02 1932.5 01/15 1044.0 1684.5
1991 06/10 456.0 02/22 355.6 391.2 2010* 01/19 1880.0 02/05 1483.0
AT PRESS TIME
*Through April 30, 2010
c02_CTA_2011_pgs_120-182_c02_CTA_2011_pgs_120-182 7/19/10 10:45 PM Page 155

Get Commodity Trader's Almanac 2O11 now with the O’Reilly learning platform.

O’Reilly members experience books, live events, courses curated by job role, and more from O’Reilly and nearly 200 top publishers.