CHAPTER 7
![]()
Candlestick Charts with jqPlot
Candlestick charts are widely used in the analysis of a currency over time or of price movements. This chart consists of a series of vertical bars, called candlesticks. They show the opening, closing, lowest, and highest price in a given time period (see Figure 7-1). For this reason, this kind of chart is often called an OHLC chart (when it reports open-high-low-close values) or an HLC chart (when it reports onlyhigh-low-close values).
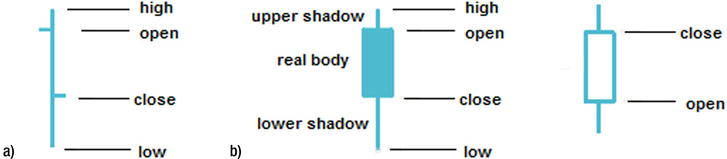
Figure 7-1. Different ways to represent OHLC data: (a) line, (b) real ...
Get Create Web Charts with jqPlot now with the O’Reilly learning platform.
O’Reilly members experience books, live events, courses curated by job role, and more from O’Reilly and nearly 200 top publishers.

