Color highlight
QlikView's natural behavior is to zoom in on the data once a selection is made. However, there is a great downside to doing this: you lose some context because the rest of the elements disappear. One of the most popular ways to overcome this phenomenon is to mix color functions with our good old friend—Set Analysis.
Example: NBA standings.
Relevant features: Set Analysis and color highlight.
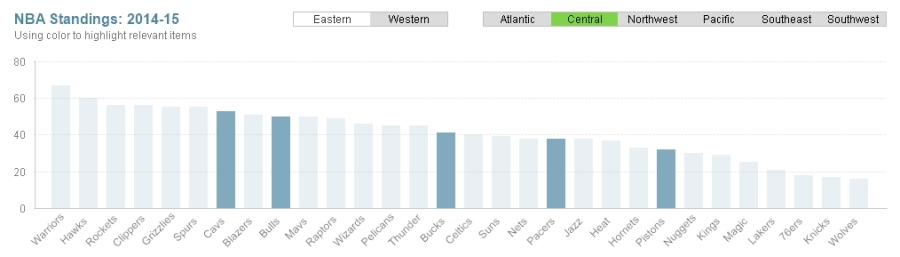
To create this visualization, you can do the following:
- Create a classic bar chart using
Teamas the dimension andsum(Wins)as the expression. - This trick is based on two parts. First, we must work with the colors so that only the possible teams ...
Get Creating Stunning Dashboards with QlikView now with the O’Reilly learning platform.
O’Reilly members experience books, live events, courses curated by job role, and more from O’Reilly and nearly 200 top publishers.

