9.2. DISTRIBUTIONAL CHARACTERISTICS OF VALUE MULTIPLES
Enterprise value multiples, like the equity multiples that we examined in the preceding chapter, have wide ranges, with some firms trading at extremely high multiples. Like equity multiples, they are constrained to be greater than zero, thus creating distributions skewed toward large positive values.
9.2.1. Value/Operating Earnings Multiples
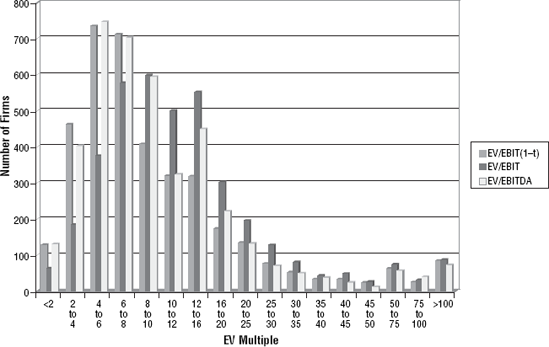
To get a better measure of the distributional characteristics of value multiples, we begin by looking at multiples of operating income in Figure 9.1. In this figure, we look at enterprise value as a multiple of EBITDA, operating income, and after-tax operating income for firms in the United States in January 2006.
Figure 9.1. Enterprise Value/Operating Income Multiples

We follow up by reporting the statistical properties, in January 2006, of each of these multiples in Table 9.3, starting with the average and median but also including the 10th and 90th percentiles of the distribution. (Chapter 8 reported on January 2005 numbers.
Like the equity earnings multiples described in the preceding chapter, multiples of operating income have large positive outliers, pushing the average values well above the median values.
Looking at the distributions of value multiples also provides us with a simple way of testing and debunking widely used rules of thumb in investing and portfolio management. ...
Get Damodaran on Valuation now with the O’Reilly learning platform.
O’Reilly members experience books, live events, courses curated by job role, and more from O’Reilly and nearly 200 top publishers.

