Here is a histogram of eruption:
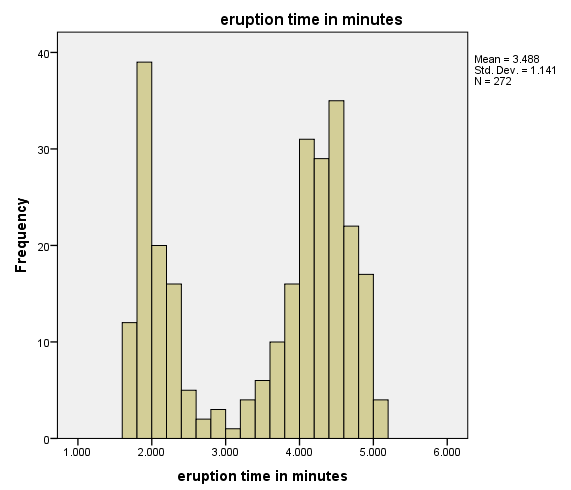
You can clearly see the bimodal nature of the distribution, with one center around 2 and another center around 4.5.
Here is a histogram of the waiting time to next eruption:
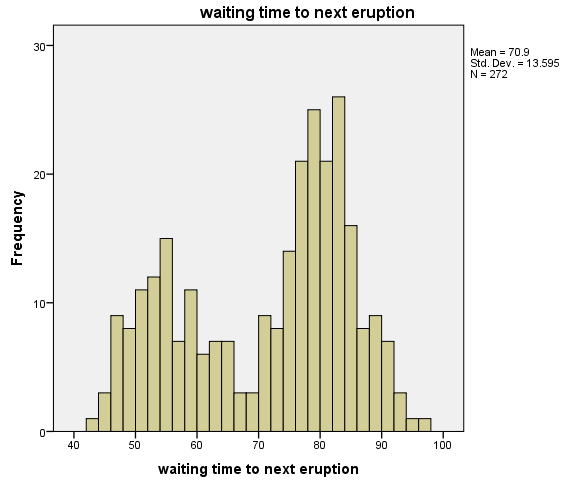
Again, you can clearly see the bimodal nature of the distribution, with one center in the mid-50s and the other in the low 80s.
You can also look at the two variables jointly, via a scatterplot. Here is the scatterplot:
The scatter of points shows a two-cluster structure. In general, shorter eruption times are associated ...

