Appendices
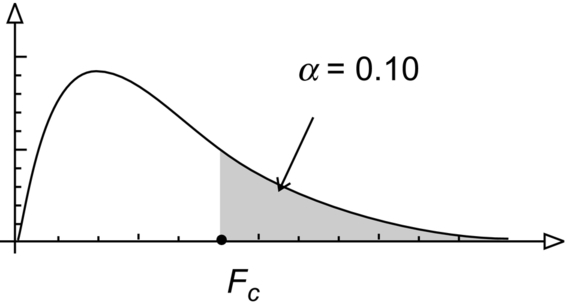
Table A
| ν2 Denominator | Numerator Degrees of Freedom (ν1) | |||||||||
|---|---|---|---|---|---|---|---|---|---|---|
| 1 | 2 | 3 | 4 | 5 | 6 | 7 | 8 | 9 | 10 | |
| 1 | 39.86 | 49.50 | 53.59 | 55.83 | 57.24 | 58.20 | 58.91 | 59.44 | 59.86 | 60.19 |
| 2 | 8.53 | 9.00 | 9.16 | 9.24 | 9.29 | 9.33 | 9.35 | 9.37 | 9.38 | 9.39 |
| 3 | 5.54 | 5.46 | 5.39 | 5.34 | 5.31 | 5.28 | 5.27 | 5.25 | 5.24 | 5.23 |
| 4 | 4.54 | 4.32 | 4.19 | 4.11 | 4.05 | 4.01 | 3.98 | 3.95 | 3.94 | 3.92 |
| 5 | 4.06 | 3.78 | 3.62 | 3.52 | 3.45 | 3.40 | 3.37 | 3.34 | 3.32 | 3.30 |
| 6 | 3.78 | 3.46 | 3.29 | 3.18 | 3.11 | 3.05 | 3.01 | 2.98 | 2.96 | 2.94 |
| 7 | 3.59 | 3.26 | 3.07 | 2.96 | 2.88 | 2.83 | 2.78 | 2.75 | 2.72 | 2.70 |
| 8 | 3.46 | 3.11 | 2.92 | 2.81 | 2.73 | 2.67 | 2.62 | 2.59 | 2.56 | 2.54 |
| 9 | 3.36 | 3.01 | 2.81 | 2.69 | 2.61 | 2.55 | 2.51 | 2.47 | 2.44 | 2.42 |
| 10 | 3.29 | 2.92 | 2.73 | 2.61 | 2.52 | 2.46 | 2.41 | 2.38 | 2.35 | 2.32 |
| 11 | 3.23 | 2.86 | 2.66 | 2.54 | 2.45 | 2.39 | 2.34 | 2.30 | 2.27 | 2.25 |
| 12 | 3.18 | 2.81 | 2.61 | 2.48 | 2.39 | 2.33 | 2.28 | 2.24 | 2.21 | 2.19 |
| 13 | 3.14 | 2.76 | 2.56 | 2.43 | 2.35 ... | |||||
Get Data Science for Business and Decision Making now with the O’Reilly learning platform.
O’Reilly members experience books, live events, courses curated by job role, and more from O’Reilly and nearly 200 top publishers.

