Showing clusters
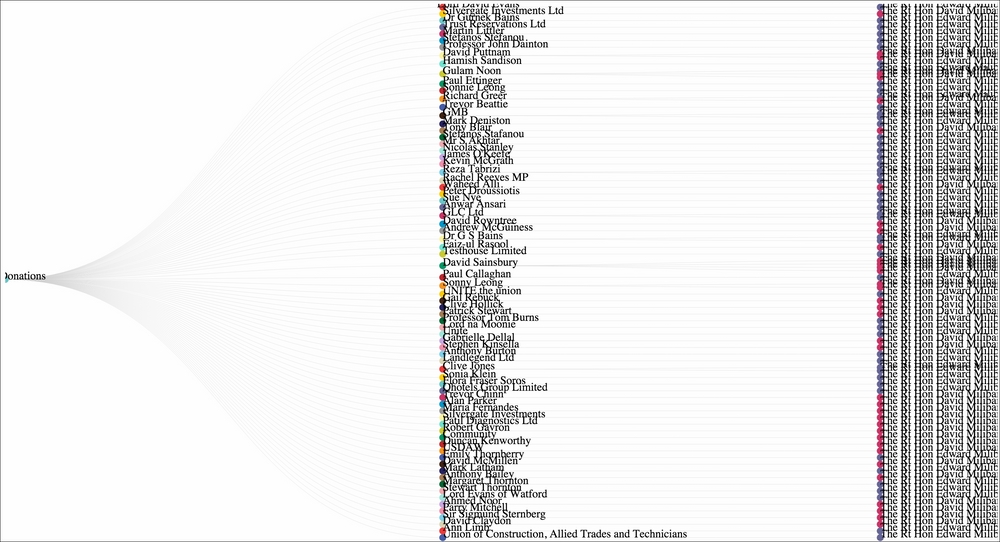
The cluster layout is the same as the tree layout, except that the leaf nodes line up.
Code-wise, this example is the same as the last, so we won't go through it again. Really, the only difference is that we don't have to flip labels at certain angles. You can look at the code in chapter5.js of the book's repo.
We end up with a very tall graph that looks something like this:

Partitioning a pie
Now we're getting somewhere! The next three layouts fit our data perfectly—we're taking three looks at how our core politicians' donations are structured.
The partition layout creates adjacency diagrams, where you don't draw nodes with links between ...
Get Data Visualization: Representing Information on Modern Web now with the O’Reilly learning platform.
O’Reilly members experience books, live events, courses curated by job role, and more from O’Reilly and nearly 200 top publishers.

