August 2024
Beginner to intermediate
416 pages
9h 31m
English
In this chapter, we will discuss an important tool that is part of the basic visualizations in Power BI: the slicer. It is a utility element, meaning it does not visualize data itself but allows filtering of the charts on the dashboard based on a selected field. In practice, no Power BI report is complete without slicers.
The conversation about slicers becomes relevant when we have at least one chart that we want to filter. By default, any slicer filters all visual elements that have related data, including other slicers. We will demonstrate how to influence this option later on, but for now, let’s understand how to build slicers and the different types they can be.
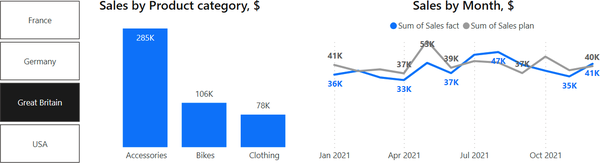
In Figure 9-1, a fragment of a dashboard with a slicer for countries is presented. After selecting Great Britain in the slicer, the charts on the right show sales by categories and monthly sales dynamics in that country.
In most tasks, slicers are built based on categorical data (such as countries, products, managers, etc.) or dates, and less frequently on quantitative values. In the case of dates and numerical values, the slicer can take the form of a slider—we drag its edges to adjust the range. In Figure 9-2, the first slicer selects the period from March 11 to August 12, while the second slicer ...
Read now
Unlock full access


 O’Reilly covers everything we've got, with content to help us build a world-class technology community, upgrade the capabilities and competencies of our teams, and improve overall team performance as well as their engagement.I wanted to learn C and C++, but it didn't click for me until I picked up an O'Reilly book. When I went on the O’Reilly platform, I was astonished to find all the books there, plus live events and sandboxes so you could play around with the technology.I’ve been on the O’Reilly platform for more than eight years. I use a couple of learning platforms, but I'm on O'Reilly more than anybody else. When you're there, you start learning. I'm never disappointed.I'm always learning. So when I got on to O'Reilly, I was like a kid in a candy store. There are playlists. There are answers. There's on-demand training. It's worth its weight in gold, in terms of what it allows me to do.