August 2024
Beginner to intermediate
416 pages
9h 31m
English
For this and further chapters, you can use the same practice dataset as for Part I.
In Chapter 8, we set up a basic card, and in Chapter 18, we explored advanced cards from the AppsSource gallery. However, the default toolkit includes several other visuals for displaying key performance indicators (KPIs). They look more original than a simple rectangle with a number, but beginners often make mistakes with them. That’s why we’ve moved the information on gauges to the part on exotic visuals. This chapter will explain why.
In the early days of BI technologies, gauges were a symbol of high-tech, advanced dashboards. After all, while bar charts and even waterfall charts could be built in Microsoft Excel, such realistic speedometers required specialized software. In Figure 19-1, you can see how those gauges looked.
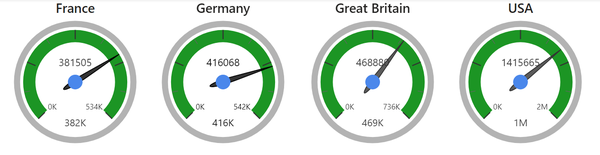
In every BI application, there is such a visual, and Power BI is no exception. Totals in the form of gauges with arrows, ranges of “good-bad” at first glance look attractive—and you immediately want to put them on the dashboard. In this chapter, we will try to convince you otherwise, showing where they really help highlight the key points and where they only distract from the data.
To create a gauge in Power BI, all you need is a single numerical value (let’s choose Sales fact), and you’ll ...
Read now
Unlock full access


 O’Reilly covers everything we've got, with content to help us build a world-class technology community, upgrade the capabilities and competencies of our teams, and improve overall team performance as well as their engagement.I wanted to learn C and C++, but it didn't click for me until I picked up an O'Reilly book. When I went on the O’Reilly platform, I was astonished to find all the books there, plus live events and sandboxes so you could play around with the technology.I’ve been on the O’Reilly platform for more than eight years. I use a couple of learning platforms, but I'm on O'Reilly more than anybody else. When you're there, you start learning. I'm never disappointed.I'm always learning. So when I got on to O'Reilly, I was like a kid in a candy store. There are playlists. There are answers. There's on-demand training. It's worth its weight in gold, in terms of what it allows me to do.