
Chapter 3. Configuration and verification 79
Enabling the DB2 instance 'SICILY1', this might take a while...
Done.
Silent configuration successfully finished.
Press any key to continue . . . _
When the configuration was successfully completed, the instance is registered
and enabled for monitoring.
3.1.5 New PE server configuration features of V2.2 Fix Pack 1
In the following section, we describe the new configuration features and the
differences from the examples shown in 3.1.4, “Server configuration examples”
on page 61.
In general, with V2.2 Fix Pack 1, the configuration tools:
Show advanced status information.
– The current status of the PE server.
– The monitoring status of the instances.
– Pending configuration changes.
Allow dynamic monitoring.
– Stop monitoring of a registered instance.
– Start monitoring of a registered instance.
– Change an instance’s configuration and activate the changes.
– Drop an instance registration and terminate monitoring.
– The dynamic monitoring means that the tasks listed can be performed
while the PE Server is running.
Advanced status information and dynamic monitoring is supported in both the
command-line interactive mode and the GUI interactive mode. Silent
configuration mode now also supports dynamically starting monitoring.
Note: For Performance Expert Server V2.2, monitoring the instance would
start when the PE server is restarted. For V2.2 Fix Pack 1, monitoring will start
immediately, if the PE server is active while we run the silent configuration.
80 DB2 Performance Expert for Multiplatforms V2.2
Windows GUI Server configuration example
The following example describes the scenario where Performance Expert Server
has been started and is monitoring the instance WISLA_DB2, which we
configured as described in the section above.
When you start the configuration GUI in V2.2 Fix Pack 1, the windows shown in
Figure 3-13 will be present.
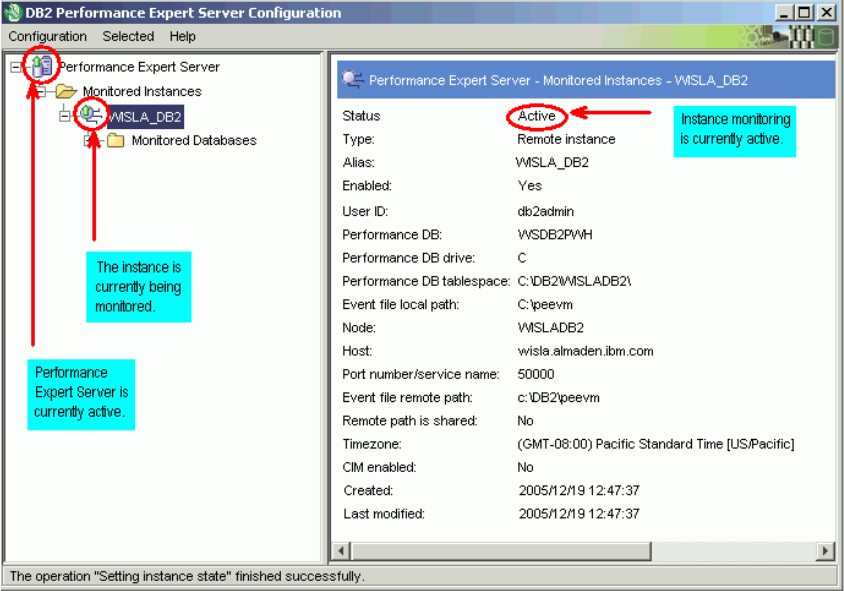
Figure 3-13 Performance Expert Server Configuration - all systems active
Advanced status information
There are several new graphical items.
To the left of the window, you can see the current status of both the Performance
Expert Server and the monitoring status of the configured instances. The green
arrow in the icon to the left of the “Performance Expert Server” tree item shows
that the PE server is currently active. The green arrow in the icon to the left of the
instance name WISLA_DB2 means that the instance is currently being monitored
Chapter 3. Configuration and verification 81
by the PE server. If instance monitoring stops for any reason or the PE server
terminates, the color of the arrows changes automatically to red.
In the details pane of the configured instance to the right of the window, there is a
new field called “Status”. This field shows “active” if the selected instance is
currently being monitored by Performance Expert Server; otherwise, it shows
“inactive”.
You may stop and start Performance Expert Server to see the icons change from
green to red and back to green when the server is up and running again.
Dynamic monitoring
Now we discuss the effect of disabling and enabling an instance for monitoring.
Stop monitoring of a registered instance.
Assume we have the scenario described above, Performance Expert Server
is actively monitoring DB2 instance WISLA_DB2. For some reason, it
becomes necessary to stop monitoring of instance WISLA_DB2 (but we do
not want to interrupt monitoring of other instances we had potentially
configured for monitoring). We can achieve this by either:
– Selecting WISLA_DB2, open the Selected menu, and select Disable
monitoring.
– Right-clicking WISLA_DB2 and select Disable monitoring.
82 DB2 Performance Expert for Multiplatforms V2.2
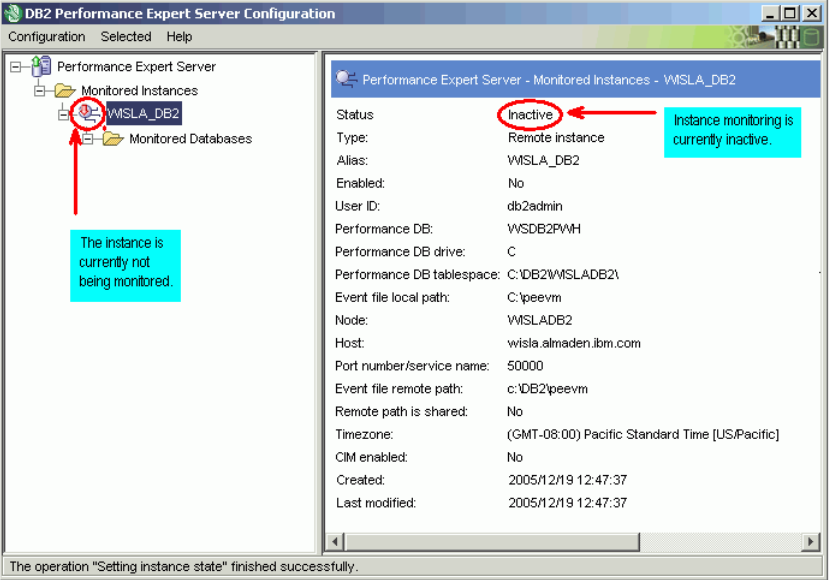
The icon to the left of the instance name WISLA_DB2 changes and now
shows a red arrow indicating that the instance is currently no longer
monitored (see Figure 3-14). Furthermore, the Status field to the right
switches to inactive. Performance Expert Server is still active.
Figure 3-14 Performance Expert Server Configuration - instance monitoring inactive
See also the Performance Expert Server console log, which shows that the
server’s monitoring components, like Performance Warehouse (PWH),
snapshot processing (SNAP), exception processing (EXCP), and so on, have
been terminated for that instance.
Start monitoring of a registered instance.
You may decide at any time to start monitoring of the selected instance again.
Just do either of the following:
– Select instance WISLA_DB2, open the Selected menu, and select
Enable monitoring.
– Right-click WISLA_DB2 and select Enable monitoring.
Get DB2 Performance Expert for Multiplatforms V2.2, 2nd Edition now with the O’Reilly learning platform.
O’Reilly members experience books, live events, courses curated by job role, and more from O’Reilly and nearly 200 top publishers.

