Chapter 1. Tools and Techniques
In this chapter we’ll take a look at common tools and techniques for deep learning. It’s a good chapter to read through once to get an idea of what’s what and to come back to when you need it.
We’ll start out with an overview of the different types of neural networks that are covered in this book. Most of the recipes later in the book focus on getting things done and only briefly discuss how deep neural networks are architected.
We’ll then discuss where to get data from. Tech giants like Facebook and Google have access to tremendous amounts of data to do their deep learning research, but there’s enough data out there for us to do interesting stuff too. The recipes in this book take their data from a wide range of sources.
The next part is about preprocessing of data. This is a very important area that is often overlooked. Even if you have the right network setup and you have great data, you still need to make sure that the data you have is presented in the best way to the network. You want to make it as easy as possible for the network to learn the things it needs to learn and not get distracted by other irrelevant bits in the data.
1.1 Types of Neural Networks
Throughout this chapter and indeed the book we will talk about networks and models. Network is short for neural network and refers to a stack of connected layers. You feed data in on one side and transformed data comes out on the other side. Each layer implements a mathematical operation on the data flowing through it and has a set of variables that can be modified that determine the exact behavior of the layer. Data here refers to a tensor, a vector with multiple dimensions (typically two or three).
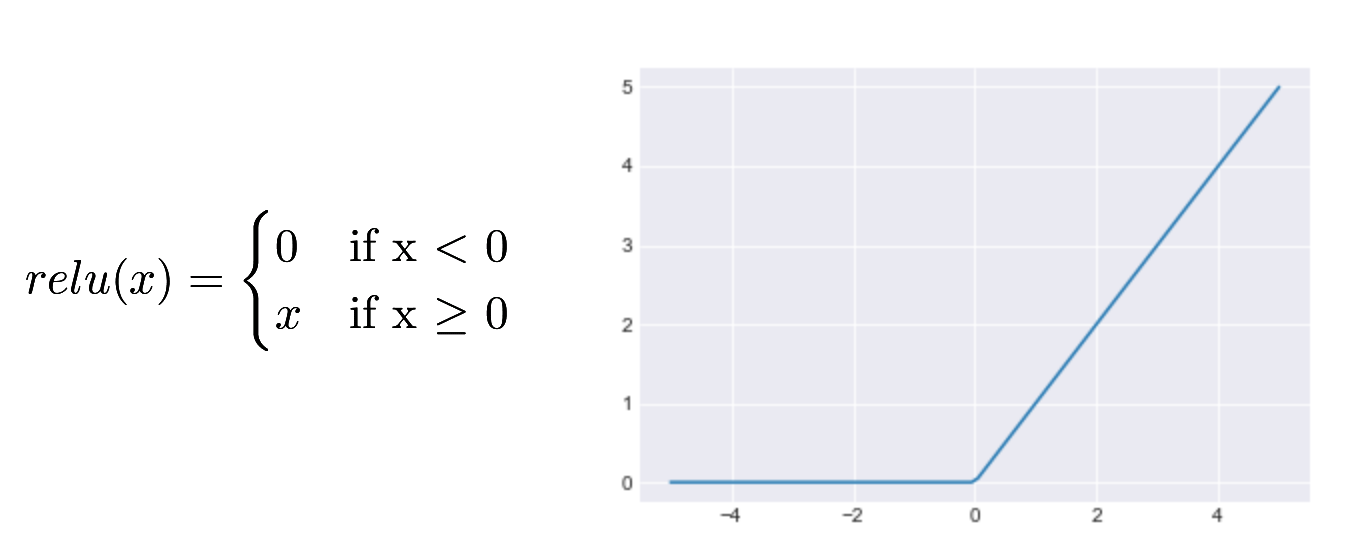
A full discussion of the different types of layers and the math behind their operations is beyond the scope of this book. The simplest type of layer, the fully connected layer, takes its input as a matrix, multiplies that matrix with another matrix called the weights, and adds a third matrix called the bias. Each layer is followed by an activation function, a mathematical function that maps the output of one layer to the input of the next layer. For example, a simple activation function called ReLU passes on all positive values, but sets negative values to zero.
Technically the term network refers to the architecture, the way in which the various layers are connected to each other, while a model is a network plus all the variables that determine the runtime behavior. Training a model modifies those variables to make the predictions fit the expected output better. In practice, though, the two terms are often used interchangeably.
The terms “deep learning” and “neural networks” in reality encompass a wide variety of models. Most of these networks will share some elements (for example, almost all classification networks will use a particular form of loss function). While the space of models is diverse, we can group most of them into some broad categories. Some models will use pieces from multiple categories: for example, many image classification networks have a fully connected section “head” to perform the final classification.
Fully Connected Networks
Fully connected networks were the first type of network to be researched, and dominated interest until the late 1980s. In a fully connected network, each output unit is calculated as a weighted sum of all of the inputs. The term “fully connected” arises from this behavior: every output is connected to every input. We can write this as a formula:
For brevity, most papers represent a fully connected network using matrix notation. In this case we are multiplying a vector of inputs with a weight matrix W to get a vector of outputs:
As matrix multiplication is a linear operation, a network that only contained matrix multiplies would be limited to learning linear mappings. In order to make our networks more expressive, we follow the matrix multiply with a nonlinear activation function. This can be any differentiable function, but a few are very common. The hyperbolic tangent, or tanh, function was until recently the dominant type of activation function, and can still be found in some models:
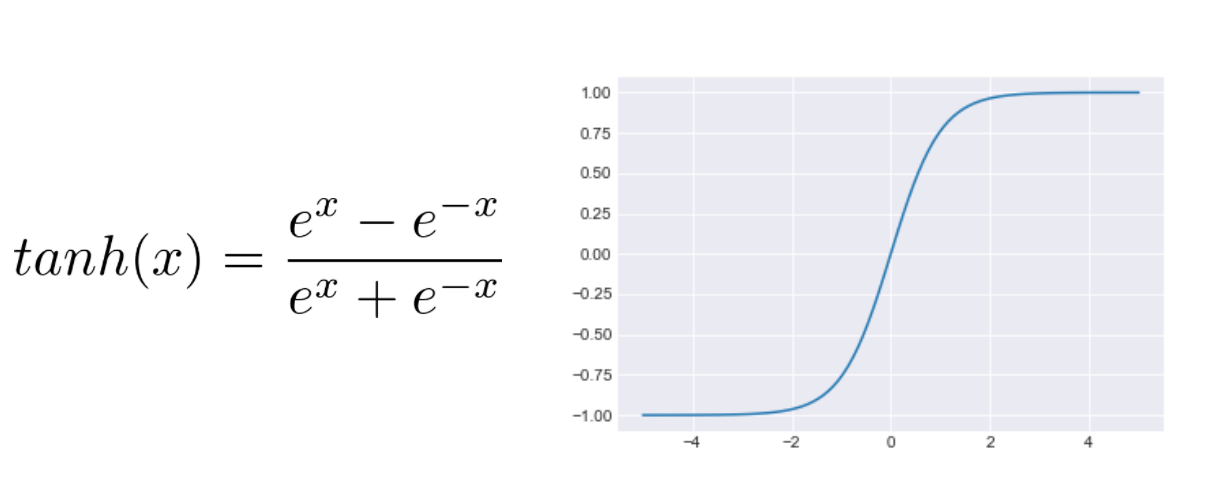
The difficulty with the tanh function is that it is very “flat” when an input is far from zero. This results in a small gradient, which means that a network can take a very long time to change behavior. Recently, other activation functions have become popular. One of the most common is the rectified linear unit, or ReLU, activation function:
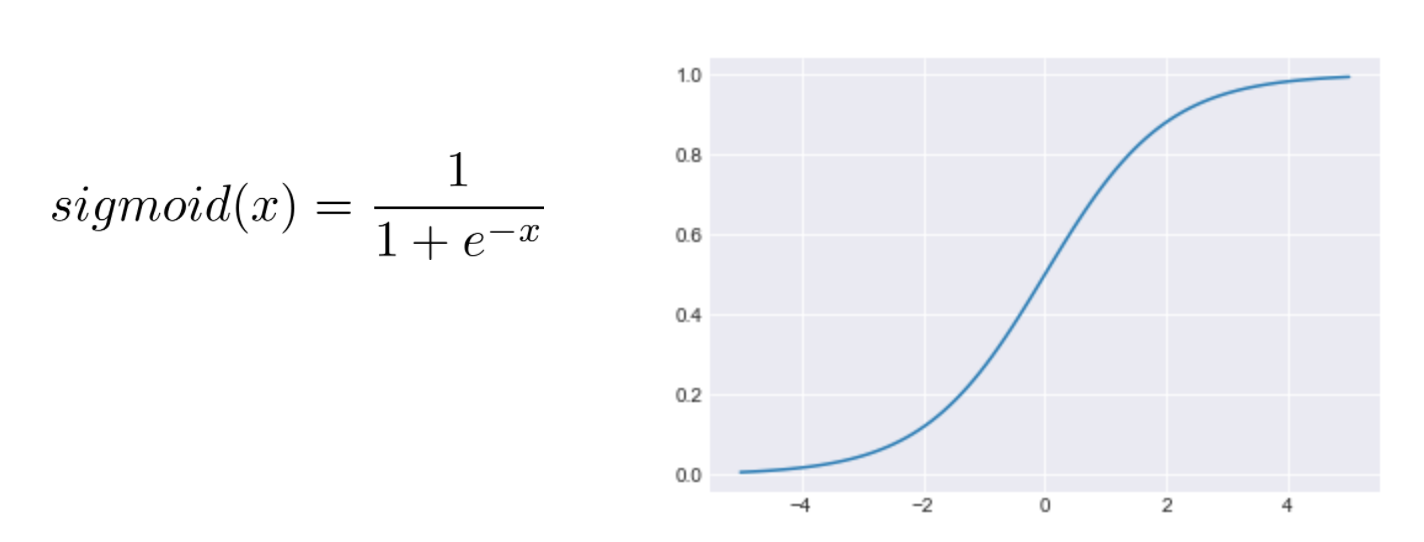
Finally, many networks use a sigmoid activation function in the last layer of the network. This function always outputs a value between 0 and 1. This allows the outputs to be treated as probabilities:
A matrix multiplication followed by the activation function is referred to as a layer of the network. In some networks the complete network can have over 100 layers, though fully connected networks tend to be limited to a handful. If we are solving a classification problem (“What type of cat is in this picture?”), the last layer of the network is called a classification layer. It will always have the same number of outputs as we have classes to choose from.
Layers in the middle of the network are called hidden layers, and the individual outputs from a hidden layer are sometimes referred to as hidden units. The term “hidden” comes from the fact that these units are not directly visible from the outside as inputs or outputs for our model. The number of outputs in these layers depends on the model:
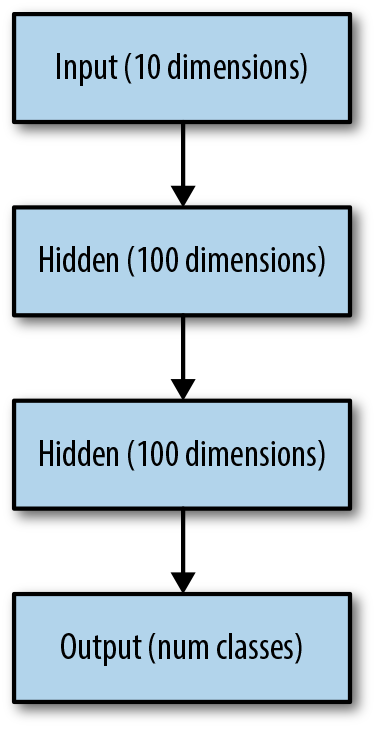
While there are some rules of thumb about how to choose the number and size of hidden layers, there is no general policy for choosing the best setup other than trial and error.
Convolutional Networks
Early research used fully connected networks to try to solve a wide variety of problems. But when our input is images, fully connected networks can be a poor choice. Images are very large: a single 256×256-pixel image (a common resolution for classification) has 256×256×3 inputs (3 colors for each pixel). If this model has a single hidden layer with 1,000 hidden units, then this layer will have almost 200 million parameters (learnable values)! Since image models require quite a few layers to perform well at classification, if we implemented them just using fully connected layers we would end up with billions of parameters.
With so many parameters, it would be almost impossible for us to avoid overfitting our model (overfitting is described in detail in the next chapter; it refers to when a network fails to generalize, but just memorizes outcomes). Convolutional neural networks (CNNs) provide a way for us to train superhuman image classifiers using far fewer parameters. They do this by mimicking how animals and humans see:

The fundamental operation in a CNN is a convolution. Instead of applying a function to an entire input image, a convolution scans across a small window of the image at a time. At each location it applies a kernel (typically a matrix multiplication followed by an activation function, just like in a fully connected network). Individual kernels are often referred to as filters. The result of applying the kernel to the entire image is a new, possibly smaller image. For example, a common filter shape is (3, 3). If we were to apply 32 of these filters to our input image, we would need 3 * 3 * 3 (input colors) * 32 = 864 parameters—that’s a big savings over a fully connected network!
Subsampling
This operation saves on the number of parameters, but now we have a different problem. Each layer in the network can only “look” at a 3×3 layer of the image at a time: if this is the case, how can we possibly recognize objects that take up the entire image? To handle this, a typical convolution network uses subsampling to reduce the size of the image as it passes through the network. Two common mechanisms are used for subsampling:
- Strided convolutions
-
In a strided convolution, we simply skip one or more pixels while sliding our convolution filter across the image. This results in a smaller size image. For example, if our input image was 256×256, and we skip every other pixel, then our output image will be 128×128 (we are ignoring the issue of padding at the edges of the image for simplicity). This type of strided downsampling is commonly found in generator networks (see “Adversarial Networks and Autoencoders”).
- Pooling
-
Instead of skipping over pixels during convolution, many networks use pooling layers to shrink their inputs. A pooling layer is actually another form of convolution, but instead of multiplying our input by a matrix, we apply a pooling operator. Typically pooling uses the max or average operator. Max pooling takes the largest value from each channel (color) over the region it is scanning. Average pooling instead averages all of the values over the region. (It can be thought of as a simple type of blurring of the input.)
One way to think about subsampling is as a way to increase the abstraction level of what the network is doing. On the lowest level, our convolutions detect small, local features. There are many features that are not very deep. With each pooling step, we increase the abstraction level; the number of features is reduced, but the depth of each feature increases. This process is continued until we end up with very few features with a high level of abstraction that can be used for prediction.
Recurrent Networks
Recurrent neural networks (RNNs) are similar in concept to CNNs but are structurally very different. Recurrent networks are frequently applied when we have a sequential input. These inputs are commonly found when working with text or voice processing. Instead of processing a single example completely (as we might use a CNN for an image), with sequential problems we can process only a portion of the problem at a time. For example, let’s consider building a network that writes Shakespearean plays for us. Our input would naturally be the existing plays by Shakespeare:
Lear. Attend the lords of France and Burgundy, Gloucester.
Glou. I shall, my liege.
What we want the network to learn to do is to predict the next word of the play for us. To do so, it needs to “remember” the text that it has seen so far. Recurrent networks give us a mechanism to do this. They also allow us to build models that naturally work across inputs of varying lengths (sentences or chunks of speech, for example). The most basic form of an RNN looks like this:
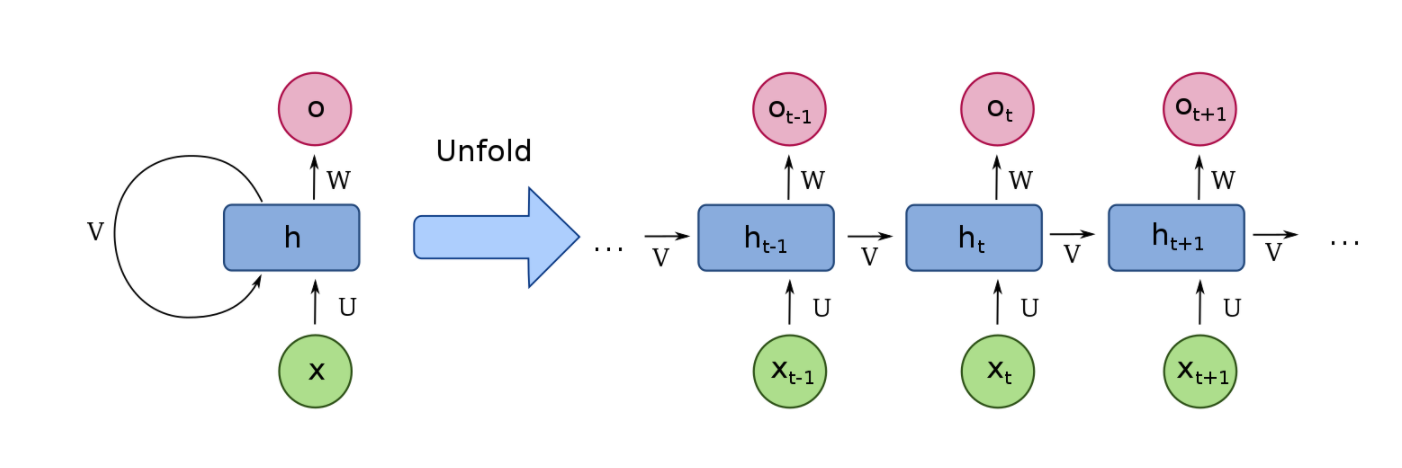
Conceptually, you can think of this RNN as a very deep fully connected network that we have “unrolled.” In this conceptual model, each layer of the network takes two inputs instead of the one we are used to:

Recall that in our original fully connected network, we had a matrix multiplication operation like:
The simplest way to add our second input to this operation is to just concatenate it to our hidden state:
where in this case the “|” stands for concatenate. As with our fully connected network, we can apply an activation function to the output of our matrix multiplication to obtain our new state:
With this interpretation of our RNN, we also can easily understand how it can be trained: we simply treat the RNN as we would an unrolled fully connected network and train it normally. This is referred to in literature as backpropagation through time (BPTT). If we have very long inputs, it is common to split them into smaller-sized pieces and train each piece independently. While this does not work for every problem, it is generally safe and is a widely used technique.
Vanishing gradients and LSTMs
Our naive RNN unfortunately tends to perform more poorly than we would like for long input sequences. This is because its structure makes it likely to encounter the “vanishing gradients” problem. Vanishing gradients result from the fact that our unrolled network is very deep. Each time we go through an activation function, there’s a chance it will result in a small gradient getting passed through (for instance, ReLU activation functions have a zero gradient for any input < 0). Once this happens for a single unit, no more training can be passed down further through the network via that unit. This results in an ever-sparser training signal as we go down. The observed result is extremely slow or nonexistent learning of the network.
To combat this, researchers developed an alternative mechanism for building RNNs. The basic model of unrolling our state over time is kept, but instead of doing a simple matrix multiply followed by the activation function, we have a more complex way of passing our state forward (source: Wikipedia):
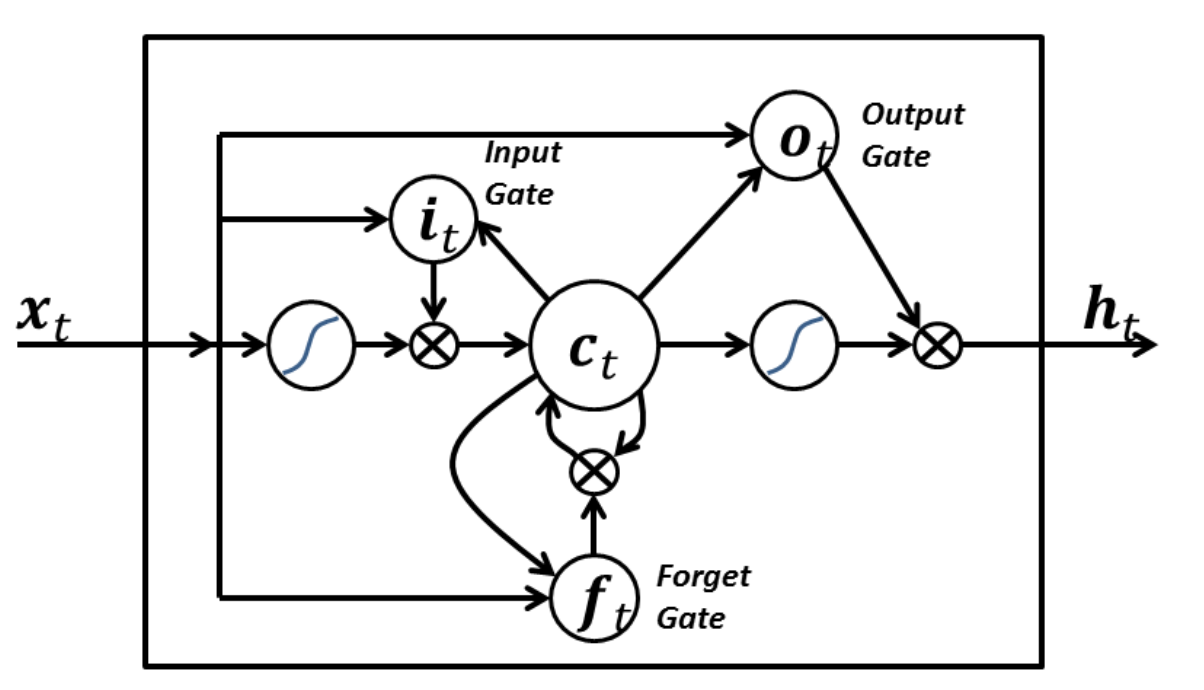
A long short-term memory network (LSTM) replaces our single matrix multiplication with four, and introduces the idea of gates that are multiplied with a vector. The key behavior that enables an LSTM to learn more effectively than vanilla RNNs is that there is always a path from the final prediction to any layer that preserves gradients. The details of how it accomplishes this are beyond the scope of this chapter, but several excellent tutorials exist on the web.
Adversarial Networks and Autoencoders
Adversarial networks and autoencoders do not introduce new structural components, like the networks we’ve talked about so far. Instead, they use the structure most appropriate to the problem: an adversarial network or autoencoder for images will use convolutions, for example. Where they differ is in how they are trained. Most normal networks are trained to predict an output (is this a cat?) from an input (a picture):
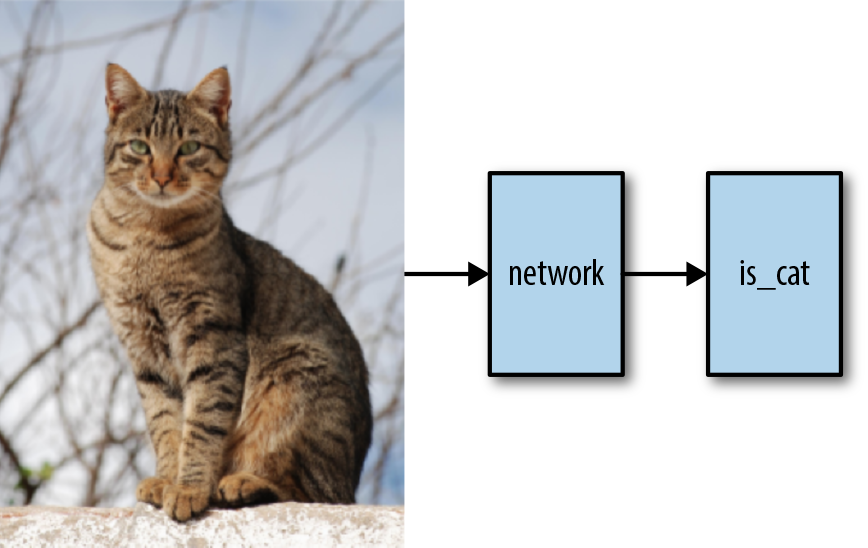
Autoencoders are instead trained to output back the image they are presented:
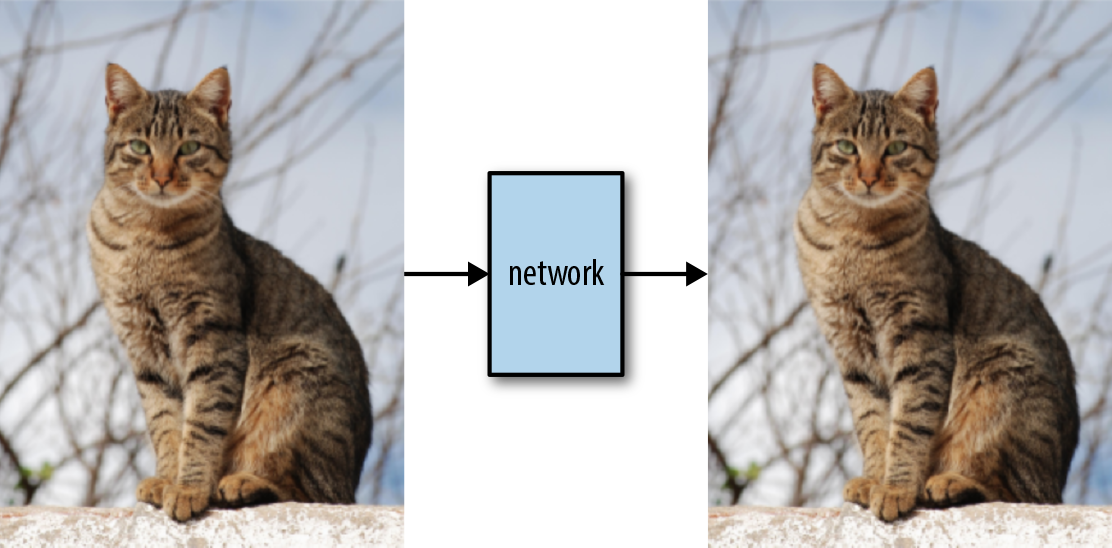
Why would we want to do this? If the hidden layers in the middle of our network contain a representation of the input image that has (significantly) less information than the original image yet from which the original image can be reconstructed, then this results in a form of compression: we can take any image and represent it just by the values from the hidden layer. One way to think about this is that we take the original image and use the network to project it into an abstract space. Each point in that space can then be converted back into an image.
Autoencoders have been successfully applied to small images, but the mechanism for training them does not scale up to larger problems. The space in the middle from which the images are drawn is in practice not “dense” enough, and many of the points don’t actually represent coherent images.
We’ll seen an example of an autoencoder network in Chapter 13.
Adversarial networks are a more recent model that can actually generate realistic images. They work by splitting the problem into two parts: a generator network and a discriminator network. The generator network takes a small random seed and produces a picture (or text). The discriminator network tries to determine if an input image is “real” or if it came from the generator network.
When we train our adversarial model, we train both of these networks at the same time:
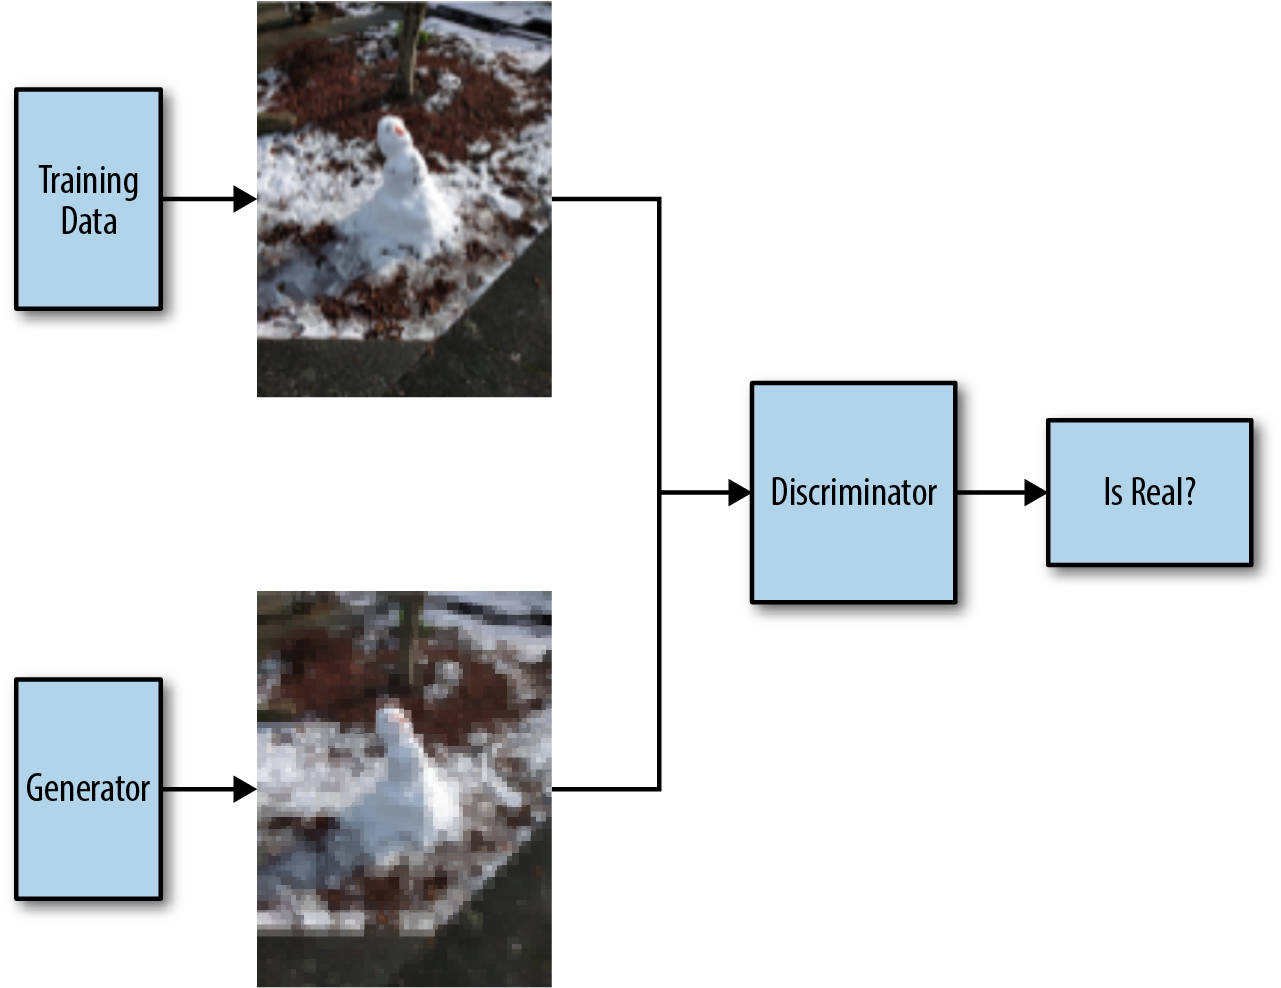
We sample some images from our generator network and feed them through our discriminator network. The generator network is rewarded for producing images that can fool the discriminator. The discriminator network also has to correctly recognize real images (it can’t just always say an image is a fake). By making the networks compete against each other, this procedure can result in a generator network that produces high-quality natural images. Chapter 14 shows how we can use generative adversarial networks to generate icons.
Conclusion
There are a great many ways to architect a network, and the choice obviously is mostly driven by the purpose of the network. Designing a new type of network is firmly in the research realm, and even reimplementing a type of network described in a paper is hard. In practice the easiest thing to do is to find an example that does something in the direction of what you want and change it step by step until it really does what you want.
1.2 Acquiring Data
One of the key reasons why deep learning has taken off in recent years is the dramatic increase in the availability of data. Twenty years ago networks were trained with thousands of images; these days companies like Facebook and Google work with billions of images.
Having access to all the information from their users no doubt gives these and other internet giants a natural advantage in the deep learning field. However, there are many data sources easily accessible on the internet that, with a little massaging, can fit many training purposes. In this section, we’ll discuss the most important ones. For each, we’ll look into how to acquire the data, what popular libraries are available to help with parsing, and what typical use cases are. I’ll also refer you to any recipes that use this data source.
Wikipedia
Not only does the English Wikipedia comprise more than 5 million articles, but Wikipedia is also available in hundreds of languages, albeit with widely different levels of depth and quality. The basic wiki idea only supports links as a way to encode structure, but over time Wikipedia has gone beyond this.
Category pages link to pages that share a property or a subject, and since Wikipedia pages link back to their categories, we can effectively use them as tags. Categories can be very simple, like “Cats,” but sometimes encode information in their names that effectively assigns (key, value) pairs to a page, like “Mammals described in 1758.” The category hierarchy, like much on Wikipedia, is fairly ad hoc, though. Moreover, recursive categories can only be traced by walking up the tree.
Templates were originally designed as segments of wiki markup that are meant to be copied automatically (“transcluded”) into a page. You add them by putting the template’s name in {{double braces}}. This made it possible to keep the layout of different pages in sync—for example, all city pages have an info box with properties like population, location, and flag that are rendered consistently across pages.
These templates have parameters (like the population) and can be seen as a way to embed structured data into a Wikipedia page. In Chapter 4 we use this to extract a set of movies that we then use to train a movie recommender system.
Wikidata
Wikidata is Wikipedia’s structured data cousin. It is lesser known and also less complete, but even more ambitious. It is intended to provide a common source of data that can be used by anyone under a public domain license. As such, it makes for an excellent source of freely available data.
All Wikidata is stored as triplets of the form (subject, predicate, object). All subjects and predicates have their own entries in Wikidata that list all predicates that exist for them. Objects can be Wikidata entries or literals such as strings, numbers, or dates. This structure takes inspiration from early ideas around the semantic web.
Wikidata has its own query language that looks like SQL with some interesting extensions. For example:
SELECT?item?itemLabel?picWHERE{?itemwdt:P31wd:Q146.OPTIONAL{?itemwdt:P18?pic}SERVICEwikibase:label{bd:serviceParamwikibase:language"[AUTO_LANGUAGE],en"}}
will select a series of cats and their pictures. Anything that starts with a question mark is a variable. wdt:P31, or property 31, means “is an instance of,” and wd:Q146 is the class of house cats. So the fourth line stores in item anything that is an instance of cats. The OPTIONAL { .. } clause then tries to look up pictures for the item and the last magic line tries to find a label for the item using the auto-language feature or, failing that, English.
In Chapter 10 we use a combination of Wikidata and Wikipedia to acquire canonical images for categories to use as a basis for a reverse image search engine.
OpenStreetMap
OpenStreetMap is like Wikipedia, but for maps. Whereas with Wikipedia the idea is that if everybody in the world put down everything they knew in a wiki, we’d have the best encyclopedia possible, OpenStreetMap (OSM) is based on the idea that if everybody put the roads they knew in a wiki, we’d have the best mapping system possible. Remarkably, both of these ideas have worked out quite well.
While the coverage of OSM is rather uneven, ranging from areas that are barely covered to places where it rivals or exceeds what can be found on Google Maps, the sheer amount of data and the fact that it is all freely available makes it a great resource for all types of projects that are of a geographical nature.
OSM is downloadable for free in a binary format or a huge XML file. The whole world is tens of gigabytes, but there are a number of locations on the internet where we can find OSM dumps per country or region if we want to start smaller.
The binary and XML formats both have the same structure: a map is made out of a series of nodes that each have a latitude and a longitude, followed by a series of ways that combine previously defined nodes into larger structures. Finally, there are relations that combine anything that was seen before (nodes, ways, or relations) into superstructures.
Nodes are used to represents points on the maps, including individual features, as well as to define the shapes of ways. Ways are used for simple shapes, like buildings and road segments. Finally, relations are used for anything that contains more than one shape or very big things like coastlines or borders.
Later in the book, we’ll look at a model that takes in satellite images and rendered maps and tries to learn to recognize roads automatically. The actual data used for those recipes is not specifically from OSM, but it is the sort of thing that OSM is used for in deep learning. The “Images to OSM” project, for example, shows how to train a network to learn to extract shapes of sports fields from satellite images to improve OSM itself.
As a social network Twitter might have trouble competing with the much bigger Facebook, but as a source for text to train deep learning models, it is much better. Twitter’s API is nicely rounded and allows for all kinds of apps. To the budding machine learning hacker though, the streaming API is possibly the most interesting.
The so-called Firehose API offered by Twitter streams all tweets directly to a client. As one can imagine, this is a rather large amount of data. On top of that, Twitter charges serious money for this. It is less known that the free Twitter API offers a sampled version of the Firehose API. This API returns only 1% of all tweets, but that is plenty for many text processing applications.
Tweets are limited in size and come with a set of interesting metainformation like the author, a timestamp, sometimes a location, and of course tags, images, and URLs. In Chapter 7 we look at using this API to build a classifier to predict emojis based on a bit of text. We tap into the streaming API and keep only the tweets that contain exactly one emoji. It takes a few hours to get a decent training set, but if you have access to a computer with a stable internet connection, letting it run for a few days shouldn’t be an issue.
Twitter is a popular source of data for experiments in sentiment analysis, which arguably predicting emojis is a variation of, but models aimed at language detection, location disambiguation, and named entity recognition have all been trained successfully on Twitter data too.
Project Gutenberg
Long before Google Books—in fact, long before Google and even the World Wide Web, back in 1971, Project Gutenberg launched with the aim to digitize all books. It contains the full text of over 50,000 works, not just novels, poetry, short stories, and drama, but also cookbooks, reference works, and issues of periodicals. Most of the works are in the public domain and they can all be freely downloaded from the website.
This is a massive amount of text in a convenient format, and if you don’t mind that most of the texts are a little older (since they are no longer in copyright) it’s a very good source of data for experiments in text processing. In Chapter 5 we use Project Gutenberg to get a copy of Shakespeare’s collected works as a basis to generate more Shakespeare-like texts. All it takes is this one-liner if you have the Python library available:
shakespeare=strip_headers(load_etext(100))
The material available via Project Gutenberg is mostly in English, although a small amount of works are available in other languages. The project started out as pure ASCII but has since evolved to support a number of character encodings, so if you download a non-English text, you need to make sure that you have the right encoding—not everything in the world is UTF-8 yet. In Chapter 8 we extract all dialogue from a set of books retrieved from Project Gutenberg and then train a chatbot to mimic those conversations.
Flickr
Flickr is a photo sharing site that has been in operation since 2004. It originally started as a side project for a massively multiplayer online game called Game Neverending. When the game failed to become a business on its own, the company’s founders realized that the photo sharing part of the company was taking off and so they executed what is called a pivot, completely changing the main focus of the company. Flickr was sold to Yahoo a year later.
Among the many, many photo sharing sites out there, Flickr stands out as a useful source of images for deep learning experiments for a few reasons.
One is that Flickr has been at this for a long time and has collected a set of billions of images. This might pale in comparison to the number of images that people upload to Facebook in a single month, but since users upload photos to Flickr that they are proud of for public consumption, Flickr images are on average of higher quality and of more general interest.
A second reason is licensing. Users on Flickr pick a license for their photos, and many pick some form of Creative Commons licensing that allows for reuse of some kind without asking permission. While you typically don’t need this if you run a bunch of photos through your latest nifty algorithm and are only interested in the end results, it is quite essential if your project ultimately needs to republish the original or modified images. Flickr makes this possible.
The last and possibly most important advantage that Flickr has over most of its competitors is the API. Just like Twitter’s, it is a well-thought-out, REST-style API that makes it easy to do anything you can do with the site in an automatic fashion. And just like with Twitter there are good Python bindings for the API, which makes it even easier to start experimenting. All you need is the right library and a Flickr API key.
The main features of the API relevant for this book are searching for images and fetching of images. The search is quite versatile and mimics most of the search options of the main website, although some advanced filters are unfortunately missing. Fetching images can be done for a large variety of sizes. It is often useful to get started more quickly with smaller versions of the images first and scale up later.
In Chapter 9 we use the Flickr API to fetch two sets of images, one with dogs and one with cats, and train a classifier to learn the difference between the two.
The Internet Archive
The Internet Archive has a stated mission of providing “universal access to all knowledge.” The project is probably most famous for its Wayback Machine, a web interface that lets users look at web pages over time. It contains over 300 billion captures dating all the way back to 2001 in what the project calls a three-dimensional web index.
But the Internet Archive is far bigger than the Wayback Machine and comprises a ragtag assortment of documents, media, and datasets covering everything from books out of copyright to NASA images to cover art for CDs to audio and video material. These are all really worth browsing through and often inspire new projects on the spot.
One interesting example is a set of all Reddit comments up to 2015 with over 50 million entries. This started out as a project of a Reddit user who just patiently used the Reddit API to download all of them and then announced that on Reddit. When the question came up of where to host it, the Internet Archive turned out to be a good option (though the same data can be found on Google’s BigQuery for even more immediate analysis).
An example we use in this book is the set of Stack Exchange questions. Stack Exchange has always been licensed under a Creative Commons license, so nothing would stop us from downloading these sets ourselves, but getting them from the Internet Archive is so much easier. In this book we use this dataset to train a model to match questions with answers (see Chapter 6).
Crawling
If you need anything specific for your project, chances are that the data you are after is not accessible through a public API. And even if there is a public API, it might be rate limited to the point of being useless. Historic results for your favorite sports are hard to come by. Your local newspaper might have an online archive, but probably no API or data dump. Instagram has a nice API, but the recent changes to the terms of service make it hard to use it to acquire a large set of training data.
In these cases, you can always resort to scraping, or, if you want to sound more respectable, crawling. In the simplest scenario you just want to get a copy of a website on your local system and you have no prior knowledge about the structure of that website or the format of the URLs. In that case you just start with the root of the website, fetch the web content of it, extract all links from that web content, and do the same for each of those links until you find no more new links. This is how Google does it too, be it at a larger scale. Scrapy is a useful framework for this sort of thing.
Sometimes there is an obvious hierarchy, like a travel website with pages for countries, regions in those countries, cities in those regions, and finally attractions in those cities. In that case it might be more useful to write a more targeted scraper that successively works its way through the various layers of hierarchy until it has all the attractions.
Other times there is an internal API to take advantage of. Many content-oriented websites will load the overall layout and then use a JSON call back to the web server to get the actual data and insert this on the fly into the template. This makes it easy to support infinite scrolling and search. The JSON returned from the server is often easy to make sense of, as are the parameters passed to the server. The Chrome extension Request Maker shows all requests that a page makes and is a good way to see if anything useful goes over the line.
Then there are the websites that don’t want to be crawled. Google might have built an empire on scraping the world, but many of its services very cleverly detect signs of scraping and will block you and possibly anybody making requests from your IP address until you do a captcha. You can play with rate limiting and user agents, but at some point you might have to resort to scraping using a browser.
WebDriver, a framework developed for testing websites by instrumenting a browser, can be very helpful in these situations. The fetching of the pages is done with your choice of browser, so to the web server everything seems as real as it can get. You can then “click” on links using your control script to go to the next page and inspect the results. Consider sprinkling the code with delays to make it seem like a human is exploring the site and you should be good to go.
The code in Chapter 10 uses crawling techniques to fetch images from Wikipedia. There is a URL scheme to go from a Wikipedia ID to the corresponding image, but it doesn’t always pan out. In that case we fetch the page that contains the image and follow the link graph until we get to the actual image.
Other Options
There are many ways to get data. The ProgrammableWeb lists more than 18,000 public APIs (though some of those are in a state of disrepair). Here are three that are worth highlighting:
- Common Crawl
-
Crawling one site is doable if the site is not very big. But what if you want to crawl all of the major pages of the internet? The Common Crawl runs a monthly crawl fetching around 2 billion web pages each time in an easy-to-process format. AWS has this as a public dataset, so if you happen to run on that platform that’s an easy way to run jobs on the web at large.
-
Over the years the Facebook API has shifted subtly from being a really useful resource to build applications on top of Facebook’s data to a resource to build applications that make Facebook’s data better. While this is understandable from Facebook’s perspective, as a data prospector one often wonders about the data it could make public. Still, the Facebook API is a useful resource—especially the Places API in situations where OSM is just too unevenly edited.
- US government
-
The US government on all levels publishes a huge amount of data, and all of it is freely accessible. For example, the census data has detailed information about the US population, while Data.gov has a portal with many different datasets all over the spectrum. On top of that, individual states and cities have their own resources worth looking at.
1.3 Preprocessing Data
Deep neural networks are remarkably good at finding patterns in data that can help in learning to predict the labels for the data. This also means that we have to be careful with the data we give them; any pattern in the data that is not relevant for our problem can make the network learn the wrong thing. By preprocessing data the right way we can make sure that we make things as easy as possible for our networks.
Getting a Balanced Training Set
An apocryphal story relates how the US Army once trained a neural network to discriminate between camouflaged tanks and plain forest—a useful skill when automatically analyzing satellite data. At first sight they did everything right. On one day they flew a plane over a forest with camouflaged tanks in it and took pictures, and on another day they did the same when there were no tanks, making sure to photograph scenes that were similar but not quite the same. They split the data up into training and test sets and let the network train.
The network trained well and started to get good results. However, when the researchers sent it out to be tested in the wild, people thought it was a joke. The predictions seemed utterly random. After some digging, it turned out that the input data had a problem. All the pictures containing tanks had been taken on a sunny day, while the pictures with just forest happened to have been taken on a cloudy day. So while the researchers thought their network had learned to discriminate between tanks and nontanks, they really had trained a network to observe the weather.
Preprocessing data is all about making sure the network picks up on the signals we want it to pick up on and is not distracted by things that don’t matter. The first step here is to make sure that we actually have the right input data. Ideally the data should resemble as closely as possible the real-world situation.
Making sure that the signal in the data is the signal we are trying to learn seems obvious, but it is easy to get this wrong. Getting data is hard, and every source has its own peculiarities.
There are a few things we can do when we find our input data is tainted. The best thing is, of course, to rebalance the data. So in the tanks versus forest example, we would try to get pictures for both scenarios in all types of weather. (When you think about it, even if all the original pictures had been taken in sunny weather, the training set would still have been suboptimal—a balanced set would contain weather conditions of all types.)
A second option is to just throw out some data to make the set more balanced. Maybe there were some pictures of tanks taken on cloudy days after all, but not enough—so we could throw out some of the sunny pictures. This obviously cuts down the size of the training set, however, and might not be an option. (Data augmentation, discussed in “Preprocessing of Images”, could help.)
A third option is to try to fix the input data, say by using a photo filter that makes the weather conditions appear more similar. This is tricky though, and can easily lead to other or even more artifacts that the network might detect.
Creating Data Batches
Neural networks consume data in batches (sets of input/output pairs). It is important to make sure that these batches are properly randomized. Imagine we have a set of pictures, the first half all depicting cats and the second half dogs. Without shuffling, it would be impossible for the network to learn anything from this dataset: almost all batches would either contain only cats or only dogs. If we use Keras and if we have our data entirely in memory, this is easily accomplished using the fit method since it will do the shuffling for us:
char_cnn_model.fit(training_data,training_labels,epochs=20,batch_size=128)
This will randomly create batches with a size of 128 from the training_data and training_labels sets. Keras takes care of the proper randomizing. As long as we have our data in memory, this is usually the way to go.
Note
In some circumstances we might want to call fit with one batch at a time, in which case we do need to make sure things are properly shuffled. numpy.random.shuffle will do just fine, though we have to take care to shuffle the data and the labels in unison.
We don’t always have all the data in memory, though. Sometimes the data would be too big or needs to be processed on the fly and isn’t available in the ideal format. In those situations we use fit_generator:
char_cnn_model.fit_generator(data_generator(train_tweets,batch_size=BATCH_SIZE),epochs=20)
Here, data_generator is a generator that yields batches of data. The generator has to make sure that the data is properly randomized. If the data is read from a file, shuffling is not really an option. If the file comes from an SSD and the records are all the same size, we can shuffle by seeking randomly inside of the file. If this is not the case and the file has some sort of sorting, we can increase randomness by having multiple file handles in the same file, all at different locations.
When setting up a generator that produces batches on the fly, we also need to pay attention to keep things properly randomized. For example, in Chapter 4 we build a movie recommender system by training on Wikipedia articles, using as the unit of training links from the movie page to some other page. The easiest way to generate these (FromPage, ToPage) pairs would be to randomly pick a FromPage and then randomly pick a ToPage from all the links found on FromPage.
This works, of course, but it will select links from pages with fewer links on them more often than it should. A FromPage with one link on it has the same chance of being picked in the first step as a page with a hundred links. In the second step, though, that one link is certain to be picked, while any of the links from the page with a hundred links has only a small chance of selection.
Training, Testing, and Validation Data
After we’ve set up our clean, normalized data and before the actual training phase, we need to split the data up in a training set, a test set, and possibly a validation set. As with many things, the reason we do this has to do with overfitting. Networks will almost always memorize a little bit of the training data rather than learn generalizations. By separating a small amount of the data into a test set that we don’t use for training, we can measure to what extent this is happening; after each epoch we measure accuracy over both the training and the test set, and as long as the two numbers don’t diverge too much, we’re fine.
If we have our data in memory we can use train_test_split from sklearn to neatly split our data into training and test sets:
data_train,data_test,label_train,label_test=train_test_split(data,labels,test_size=0.33,random_state=42)
This will create a test set containing 33% of the data. The random_state variable is used for the random seed, which guarantees that if we run the same program twice, we get the same results.
When feeding our network using a generator, we need to do the splitting ourselves. One general though not very efficient approach would be to use something like:
deftrain_or_test(gen,train=True):fori,xinenumerate(gen):if(i%4==0)!=train:yieldx
When train is False this yields every fourth element coming from the generator gen. When it is True it yields the rest.
Sometimes a third set is split off from the training data, called the validation set. There is some confusion in the naming here; when there are only two sets the test set is sometimes also called the validation set (or holdout set). In a scenario where we have training, validation, and test sets, the validation set is used to measure performance while tuning the model. The test set is meant to be used only when all tuning is done and no more changes are going to be made to the code.
The reason to keep this third set is to stop us from manually overfitting. A complex neural network can have a very large number of tuning options or hyperparameters. Finding the right values for these hyperparameters is an optimization problem that can also suffer from overfitting. We keep adjusting those parameters until the performance on the validation set no longer increases. By having a test set that was not used during tuning, we can make sure that we didn’t inadvertently optimize our hyper parameters for the validation set.
Preprocessing of Text
A lot of neural networking problems involve text processing. Preprocessing the input texts in these situations involves mapping the input text to a vector or matrix that we can feed into a network.
Typically, the first step is to break up the text into units. There are two common ways to do this: on a character or a word basis.
Breaking up a text into a stream of single characters is straightforward and gives us a predictable number of different tokens. If all our text is in one phoneme-based script, the number of different tokens is quite restricted.
Breaking up a text into words is a more complicated tokenizing strategy, especially in scripts that don’t indicate the beginning and ending of words. Moreover, there is no obvious upper limit to the number of different tokens that we’ll end up with. A number of text processing toolkits have a “tokenize” function that usually also allows for the removal of accents and optionally converts all tokens to lowercase.
A process called stemming, where we convert each word to its root form (by dropping any grammar-related modifications), can help, especially for languages that are more grammar-heavy than English. In Chapter 8 we’ll encounter a subword tokenizing strategy that breaks up complicated words into subtokens thereby guaranteeing a specific upper limit on the number of different tokens.
Once we have our text split up into tokens, we need to vectorize it. The simplest way of doing this is called one-hot encoding. Here, we assign to each unique token an integer i from 0 to the number of tokens and then represent each token as a vector containing only 0s, except for the ith entry, which contains a 1. In Python code this would be:
idx_to_token=list(set(tokens))token_to_idx={token:idxforidx,tokeninenumerate(idx_to_token)}one_hot=lambdatoken:[1ifi==token_to_idx[token]else0foriinrange(len(idx_to_token))]encoded=np.asarray([one_hot(token)fortokenintokens])
This should leave us with a large two-dimensional array ready for consumption.
One-hot encoding works when we process text at a character level. It also works for word-level processing, though for texts with large vocabularies it can get unwieldy. There are two popular encoding strategies that work around this.
The first one is to treat a document as a “bag of words.” Here, we don’t care about the order of the words, just whether a certain word is present. We can then represent a document as a vector with an entry for each unique token. In the simplest scheme we just put a 1 if the word is present in that document and a 0 if not.
Since the top 100 most frequently occurring words in English make up about half of all texts, they are not very useful for text classifying tasks; almost all documents will contain them, so having those in our vectors doesn’t really help much. A common strategy is to just drop them from our bag of words so the network can focus on the words that do make a difference.
Term frequency–inverse document frequency, or tf–idf, is a more sophisticated version of this. Instead of storing a 1 if a token is present in a document, we store the relative frequency of the term in the document compared to how often the term occurs throughout the entire corpus of documents. The intuition here is that it is more meaningful for a less common token to appear in a document than a token that appears all the time. Scikit-learn comes with methods to calculate this automatically.
A second way to handle word-level encoding is by way of embeddings. Chapter 3 is all about embeddings and offers a good way to understand how they work. With embeddings we associate a vector of a certain size—typically with a length of 50 to 300—with each token. When we feed in a document represented as a sequence of token IDs, an embedding layer will automatically look up the corresponding embedding vectors and output a two-dimensional array.
The embedding layer will learn the right weights for each term, just like any layer in a neural network. This often takes a lot of learning, both in terms of processing and the required amount of data. A nice aspect of embeddings, though, is that there are pre-trained sets available for download and we can seed our embedding layer with these. Chapter 7 has a good example of this approach.
Preprocessing of Images
Deep neural networks have turned out to be very effective when it comes to working with images, for anything from detecting cats in videos to applying the style of different artists to selfies. As with text, though, it is essential to properly preprocess the input images.
The first step is normalization. Many networks only operate on a specific size, so the first step is to resize/crop the images to that target size. Both center cropping and direct resizing are often used, though sometimes a combination works better in order to preserve more of the image while keeping resize distortion somewhat in check.
To normalize the colors, for each pixel we usually subtract the mean value and divide by the standard deviation. This makes sure that all values on average center around 0 and that the nearly 70% of all values are within the comfortable [–1, 1] range. A new development here is the use of batch normalization; rather than normalizing all data beforehand, this subtracts the mean of the batch and divides by the standard deviation. This leads to better results and can just be made part of the network.
Data augmentation is a strategy to increase the amount of training data by adding variations of our training images. If we add to our training data versions of our images flipped horizontally, in a way we double our training data—a mirrored cat is still a cat. Looking at this in another way, what we are doing is telling our network that flips can be ignored. If all our cat pictures have the cat looking in one direction, our network might learn that that is part of catness; adding flips undoes that.
Keras has a handy ImageDataGenerator class that you can configure to produce all kinds of image variations, including rotations, translations, color adjustments, and magnification. You can then use that as a data generator for the fit_generator method on your model:
datagen=ImageDataGenerator(rotation_range=20,horizontal_flip=True)model.fit_generator(datagen.flow(x_train,y_train,batch_size=32),steps_per_epoch=len(x_train)/32,epochs=epochs)
Conclusion
Preprocessing of data is an important step before training a deep learning model. A common thread in all of this is that we want it to be as easy as possible for networks to learn the right thing and not be confused by irrelevant features of the input. Getting a balanced training set, creating randomized training batches, and the various ways to normalize the data are all a big part of this.
Get Deep Learning Cookbook now with the O’Reilly learning platform.
O’Reilly members experience books, live events, courses curated by job role, and more from O’Reilly and nearly 200 top publishers.

