Let's develop our intuition of how the autoencoder works with a simple two-dimensional example.
We first generate 10,000 points coming from a normal distribution with mean 0 and variance 1:
library(MASS)library(keras)Sigma <- matrix(c(1,0,0,1),2,2)n_points <- 10000df <- mvrnorm(n=n_points, rep(0,2), Sigma)df <- as.data.frame(df)
The distribution of the values should look as follows:
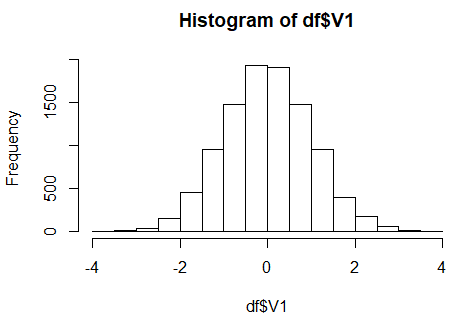
Distribution of the variable V1 we just generated; the variable V2 looks fairly similar.
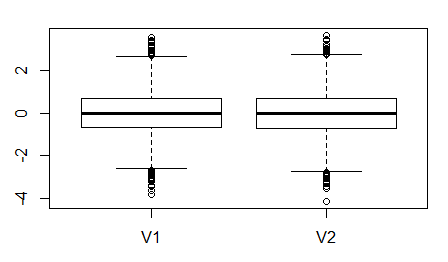
Distribution of the variables V1 and V2 we generated. ...

