8.2. Solved exercises
EXERCISE 8.1.
Design a 25th order FIR lowpass filter with a minimum transition band, using the window method. Consider a sampling frequency fs = 20 kHz and the following lower and upper passband frequency edges: f1 = 3 kHz and f2 = 7 kHz. Plot the transfer function, the impulse response and the zeros of the designed filter.
N=25; f1=3e3; f2=7e3; fs=2e4;
wn1=2*f1/fs; wn2=2*f2/fs;
b=fir1(N,[wn1 wn2],boxcar(N+1));
[h,w] = freqz(b,1); fq = fs*w/(2*pi);
amp=20*log10(abs(h)) ; phase=unwrap(angle(h) )*180/pi;
figure; subplot(221); plot(fq,amp);
axis([0 max(fq) min(amp) 10])
xlabel('Frequency [Hz]'); ylabel('Amplitude [dB]') ; grid
subplot (223); plot(fq,phase);
axis([0 max(fq) 1.2*min(phase) 1.2*max(phase)])
xlabel('Frequency [Hz]'); ylabel('Phase [°]'); grid
subplot(2,2,2); impz(b,1); xlabel('n')
subplot(2,2,4); zplane(b,1);
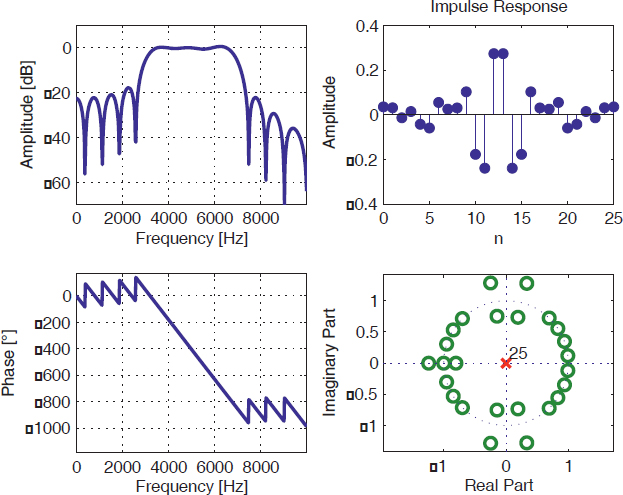
Figure 8.3. Characteristics of the filter from exercise 8.1
The rectangular window is the most suitable in this case because it provides the narrowest transition band. Since the impulse response has an even dimension (26) and is symmetric, the designed filter belongs to the 2nd class of FIR filters class.
A common error which should be avoided is to take the filter order (N) for its length or number of coefficients (N +1). Also note the presence of the zero z = −1, and the fact that the zeros occur as couples of inverse and conjugated values. ...
Get Digital Signal Processing Using Matlab now with the O’Reilly learning platform.
O’Reilly members experience books, live events, courses curated by job role, and more from O’Reilly and nearly 200 top publishers.

