Chapter 2. An Ontology of Instrumentation
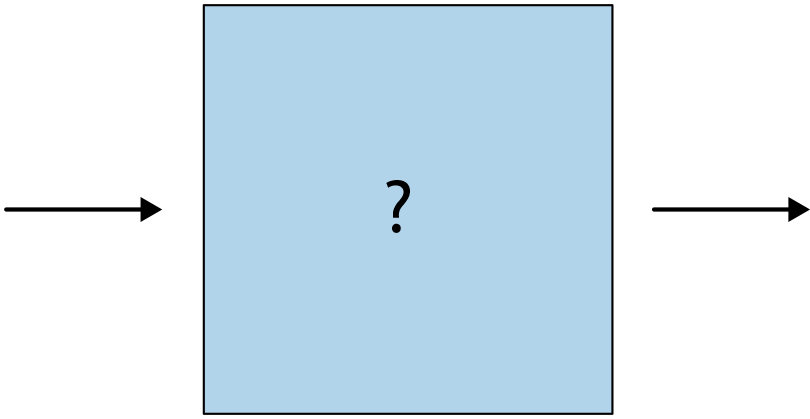
When you sketch a system diagram, what do you start with? We often start with a simple box representing a single service, as in Figure 2-1.

Figure 2-1. A visual representation of a service, component, function, or what have you.
This box is extended, added to, and connected to a variety of other boxes through dashed and solid lines, arrows, and other logically connected fabric. At the end of the day, we can’t really escape the idea of our software being this series of connected boxes on some sort of plane. Often, we aren’t able to conceptualize of our boxes as much other than a simple function that accepts inputs, does something to them, and sends the output to another box off in the distance (see Figure 2-2).
We already instrument our boxes in various ways during development to understand what’s happening inside each one—after all, practically no software is bug-free, and any system accepting input from users is likely to receive something the developer did not expect. You can think of instrumentation as anything that assists you in monitoring or measuring the performance and state of an application—so you’ll write some logs that indicate when a user inputs invalid parameters to your function, or perhaps when an operation is disallowed.
Figure 2-2. Multiple services, components, functions, etc. linked together visually.
Now, if you’re ...
Get Distributed Tracing in Practice now with the O’Reilly learning platform.
O’Reilly members experience books, live events, courses curated by job role, and more from O’Reilly and nearly 200 top publishers.

