88 Equivalence and Noninferiority Tests
Computational considerations:
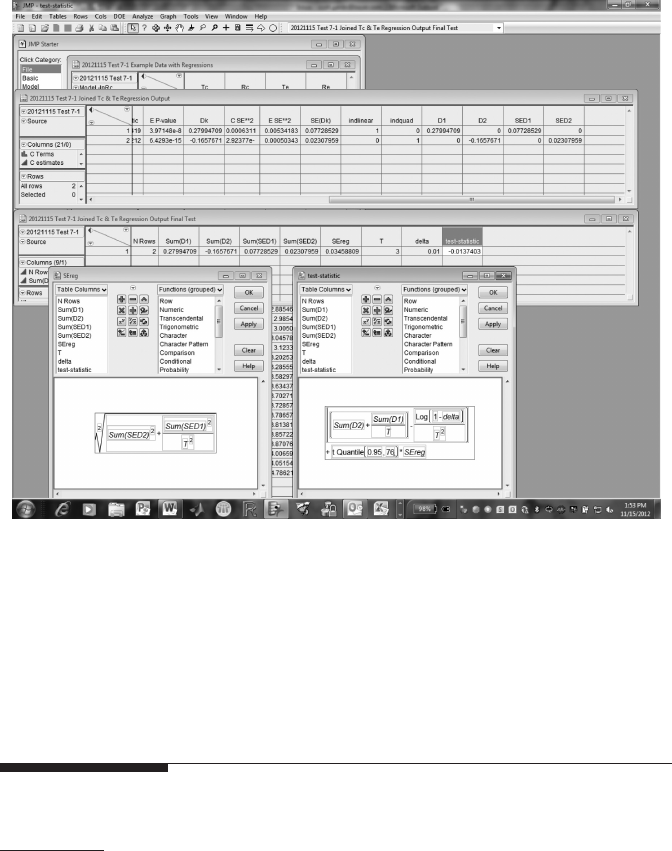
Computationally, Test 7.1 is a combination of Test 2.5 (regression slope) and
Test 2.2 (comparison of two means, xed Δ). In the example used here, the
two systems are considered equivalent at time T = 3 if the reliability of the
evaluation system, Re(T), is at least 99 percent of Rc(T) (i.e., δ = 0.01).
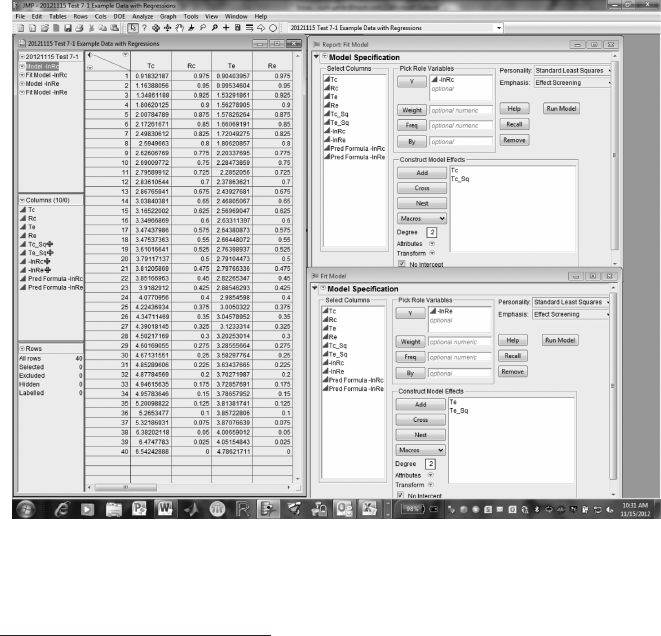
JMP Data Table and formulas (Figure 7.2 and Figure 7.3). The columns
reandrc in Figure7.2 represent the reliability functions for the time-to-event
variables, Te and Tc. You can use the “Fit Model” function to obtain coef-
cient estimates. Make sure to check the “No Intercept” option box.
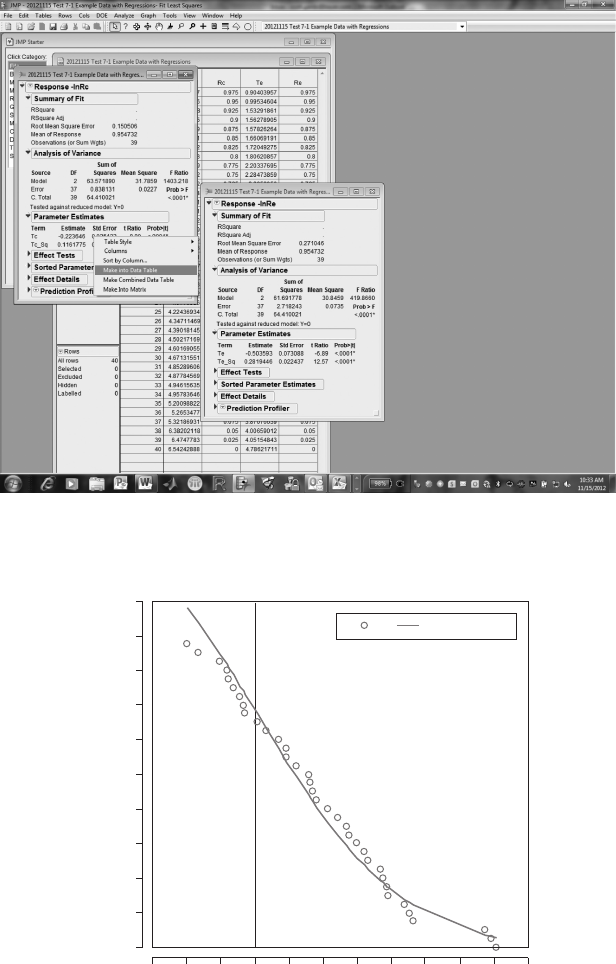
Right-click on the Parameter Estimates Chapter of the Fit Model output,
and select the “Make into Data Table” option. Create new columns to com-
pute the standard error squared, and a column that indicates the row num-
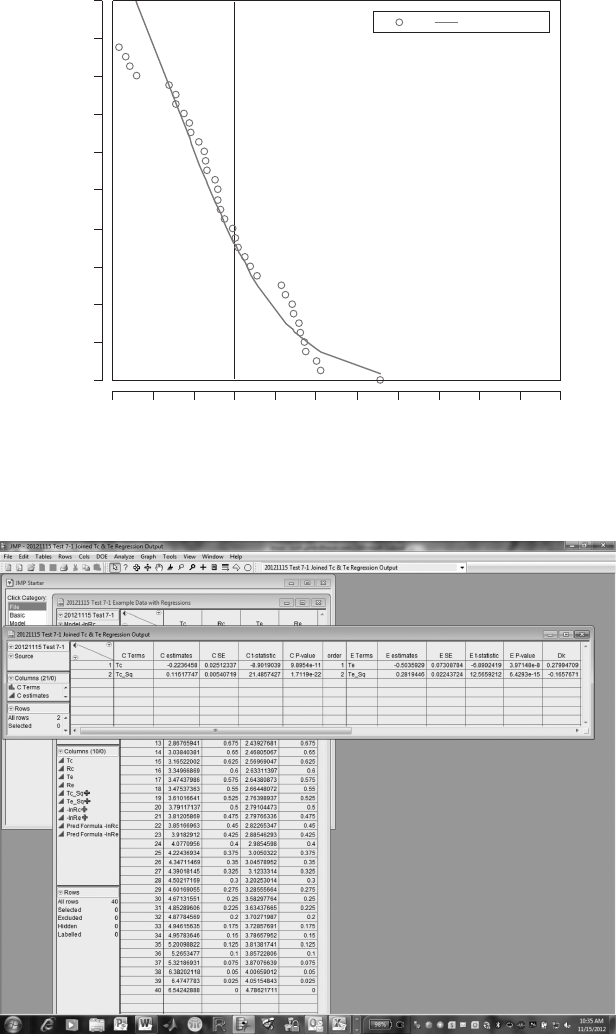
ber in each parameter estimate table (called “order” in this example). Join the
tables for Te and Tc parameter estimates using the Tables -> Join function,
with “order” as the matching column. Then compute Dk, the difference in
the parameter estimates, for the linear (order = 1) and quadratic (order = 2)
terms of the two models.
• The models and the data (Figures7.4 and 7.5):
FIGURE 7.2
Test 7.1, JMP screen 1.
89Reliability
FIGURE 7.3
Test 7.1, JMP screen 2.
1
0.9
0.8
0.7
0.6
0.5
0.4
0.3
0.2
0.1
0
R(t)
7
6.565.554.543.532.721.5
Tc
YRc Rc(t) - model
FIGURE 7.4
R
c
(t) (JMP overlay plot).
90 Equivalence and Noninferiority Tests
Test 7.1, JMP screen 3.
1
1.5 2 2.5 3 3.5 4
Te
4.5 5 5.5 6 6.5
1.7
0.9
0.8
0.7
0.6
0.5
0.4
0.3
0.2
0.1
0
R(t)
Re(t) - modelReY
FIGURE 7.5
R
e
(t) (JMP overlay plot).
91Reliability
Test 7.1, JMP screen 4.
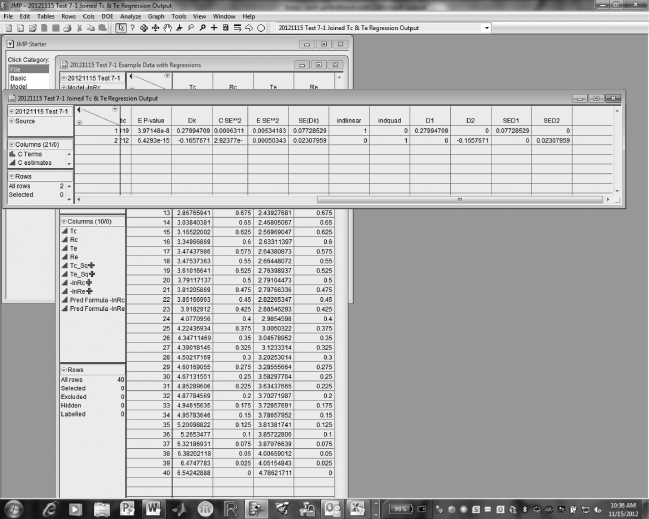
Create “dummy variable” columns (“indlinear” and “indquad”) to allow the
standard errors for the linear and quadratic coefcient estimates to be com-
puted in the same row of an output table. That is, for example, indlinear=1
for row 1 and 0 for row 2 of the estimate table. D1 is indlinear*Dk; D2 is
indquad*Dk.
92 Equivalence and Noninferiority Tests
Test 7.1, JMP screen 5.
The test statistic requires as input a particular time to event (T) and δ.
Since in this example the test statistic is less than 0, the null hypothesis is
not rejected, and the conclusion is that the two systems are not equivalent at
time T = 3.
Test 7.2 Nonparametric Test for Comparison of Reliability
Parameters:
T = time to failure
h
c
(t) = hazard rate function, comparator system (no form specied)
h
e
(t) = hazard rate function, evaluation system (no form specied)
Ht
hd
() ()
cc
t
0
∫
=τ
τ = cumulative hazard function, comparator system
Ht
hd
() ()
ee
t
0
∫
=τ
τ = cumulative hazard function, evaluation system
Get Equivalence and Noninferiority Tests for Quality, Manufacturing and Test Engineers now with the O’Reilly learning platform.
O’Reilly members experience books, live events, courses curated by job role, and more from O’Reilly and nearly 200 top publishers.

