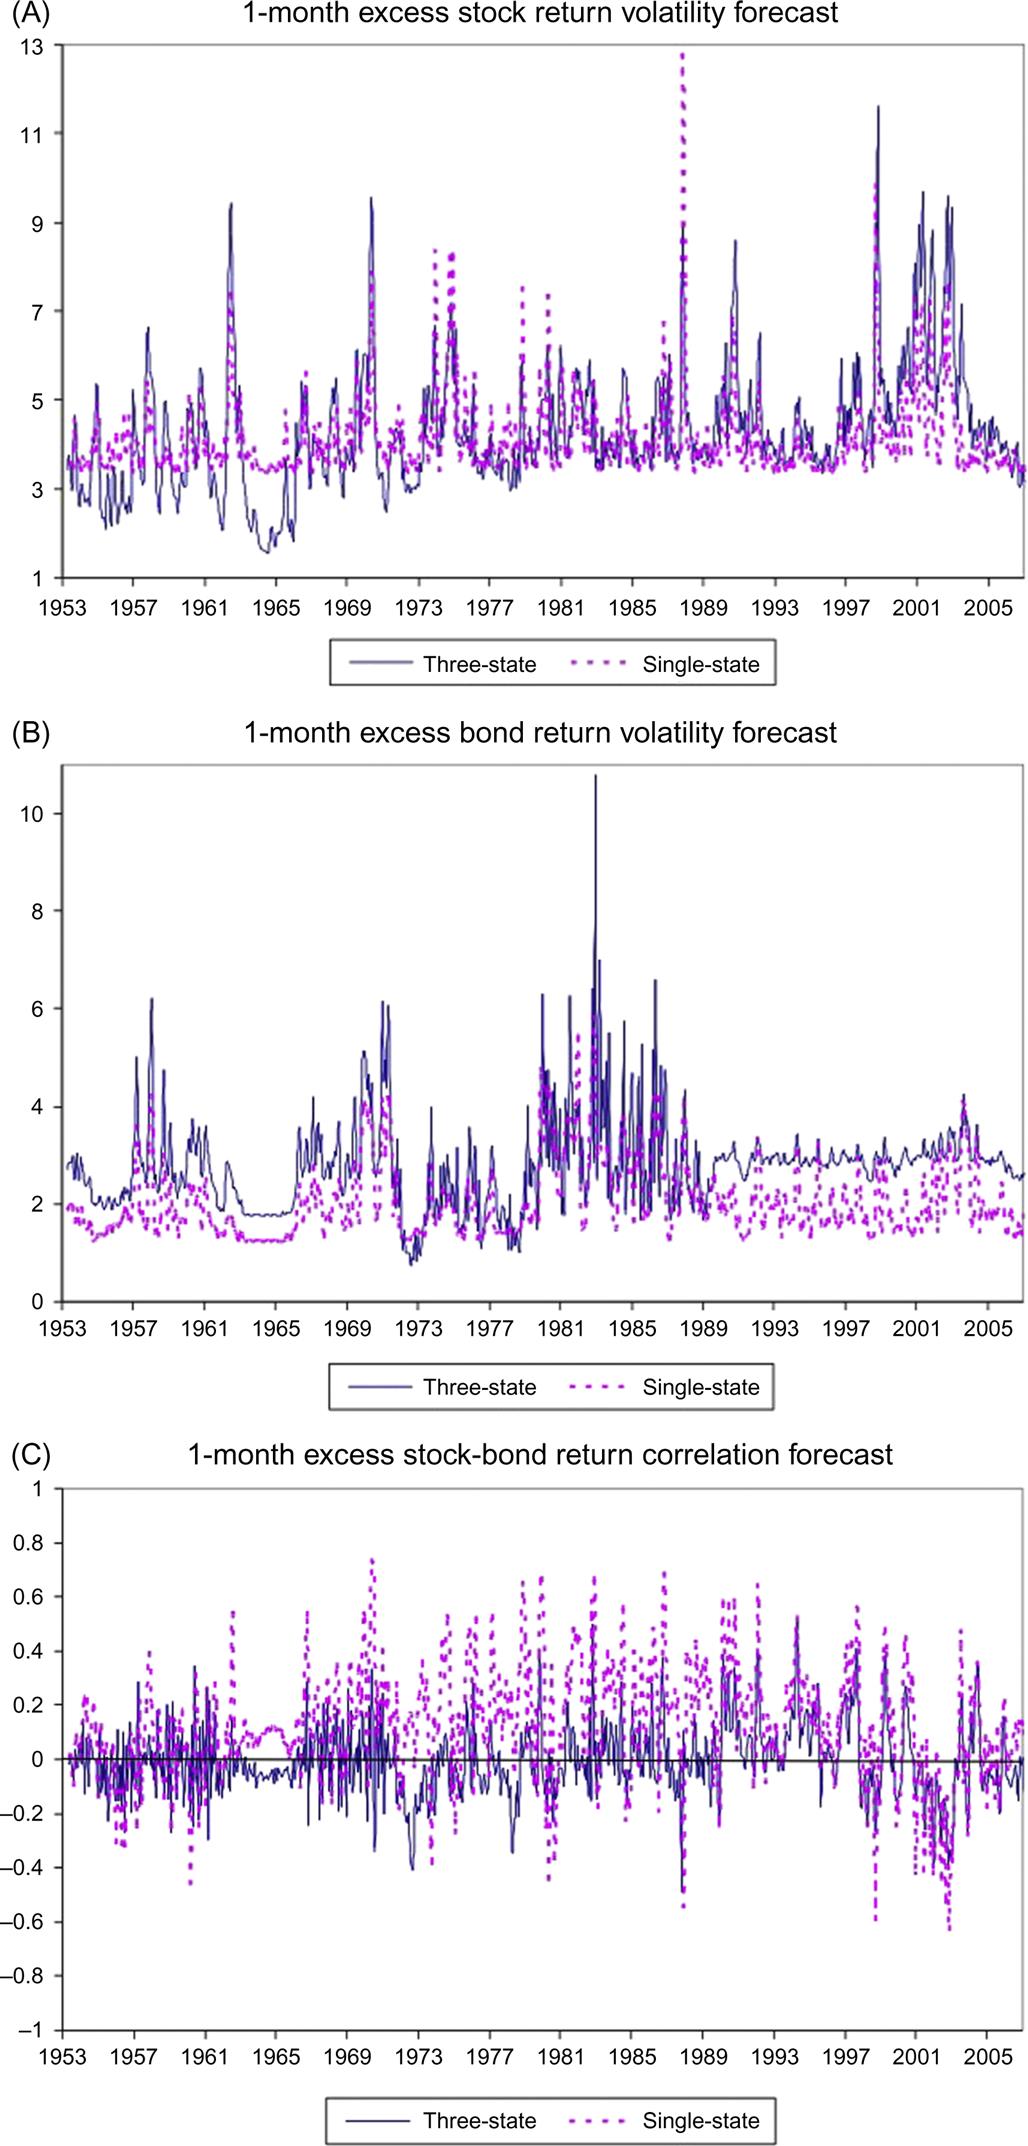
As far as equity volatility is concerned, while the single-state volatility has in practice a lower bound at around 3.4% per month, this is not the case for the three-state model. Otherwise, the two forecasts appear to be correlated (0.65), with a much higher standard deviation for the MS forecasts (1.4% vs. 1%). In the case of bond volatility, the main difference lies in the heterogeneous level of the forecast series in the periods 1953–70 and 1989–2007, when single-state forecasts are considerably lower (although they still strong comove, the overall correlation is 0.69), ...
Get Essentials of Time Series for Financial Applications now with the O’Reilly learning platform.
O’Reilly members experience books, live events, courses curated by job role, and more from O’Reilly and nearly 200 top publishers.

