October 2018
Beginner
1120 pages
28h 4m
English
Data analysis is frequently done in layers, with each layer of analysis using or building on the previous layer. When you build a pivot table using the results of a Power Query output, you are layering your analysis. When you build a query based on a table created by an SQL Server view, you are also creating a layered analysis.
You'll often find the need to build queries on top of other queries to get the results you're seeking. That's what this chapter is all about. Here you'll take a look at a few ways that you can advance your data analysis by making your queries work together.
|
You can follow along with the examples in this chapter by downloading these sample files from
|
It's common to rely on the same main data table for all kinds of analysis. Even the simple table shown in Figure 40.1 can be used to create different views: sales by employee, sales by business segment, sales by region, and so forth.
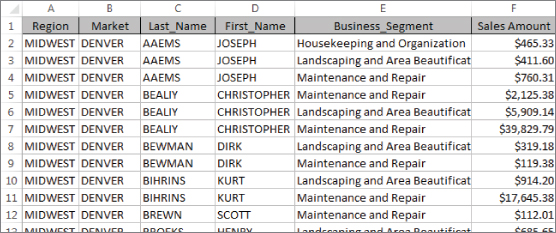
FIGURE 40.1 This data can be used as the source for various levels of aggregated analysis. ...
Read now
Unlock full access


 O’Reilly covers everything we've got, with content to help us build a world-class technology community, upgrade the capabilities and competencies of our teams, and improve overall team performance as well as their engagement.I wanted to learn C and C++, but it didn't click for me until I picked up an O'Reilly book. When I went on the O’Reilly platform, I was astonished to find all the books there, plus live events and sandboxes so you could play around with the technology.I’ve been on the O’Reilly platform for more than eight years. I use a couple of learning platforms, but I'm on O'Reilly more than anybody else. When you're there, you start learning. I'm never disappointed.I'm always learning. So when I got on to O'Reilly, I was like a kid in a candy store. There are playlists. There are answers. There's on-demand training. It's worth its weight in gold, in terms of what it allows me to do.